

Social Listening Analytics
Hear What People Say About Your Institution
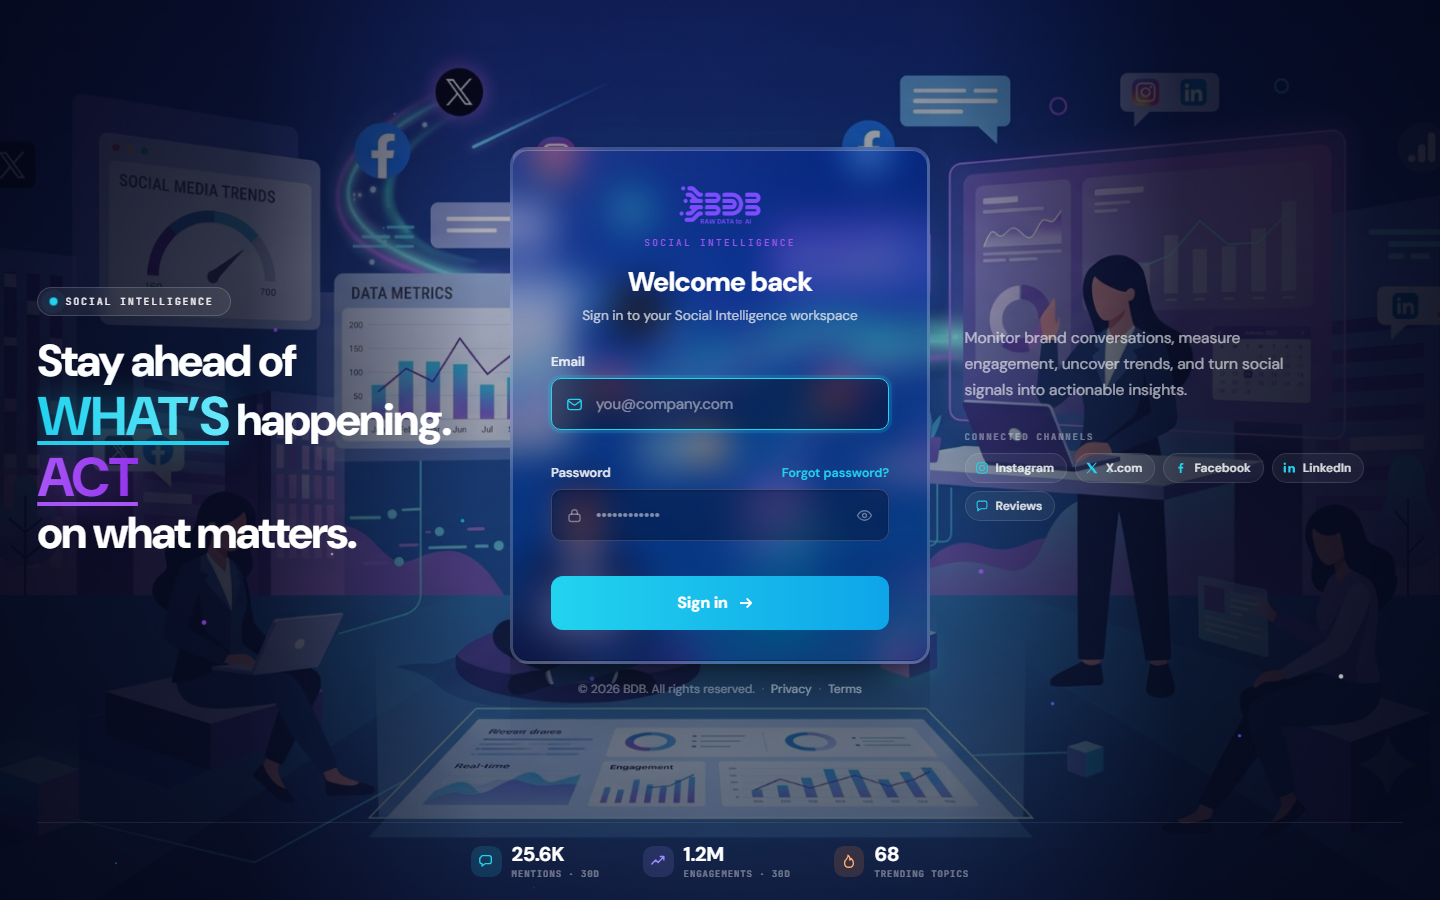
Prospective students, parents, alumni and partners talk about an institution every day on Instagram, X, Facebook, LinkedIn and review sites. Social Listening Analytics brings every post, comment and mention into one workspace and turns it into a 60-second brief: a Net Sentiment Score with health zones, mention and sentiment velocity, share of voice for the keywords the institution tracks, engagement quality, best-performing content and the signals that need attention today. Tracked keywords, competitor names and campaigns are managed in the same place, so the marketing and communications team can watch an admissions campaign, catch a reputation issue early and prove what worked.
Solution Overview
From every mention to a decision in one workspace
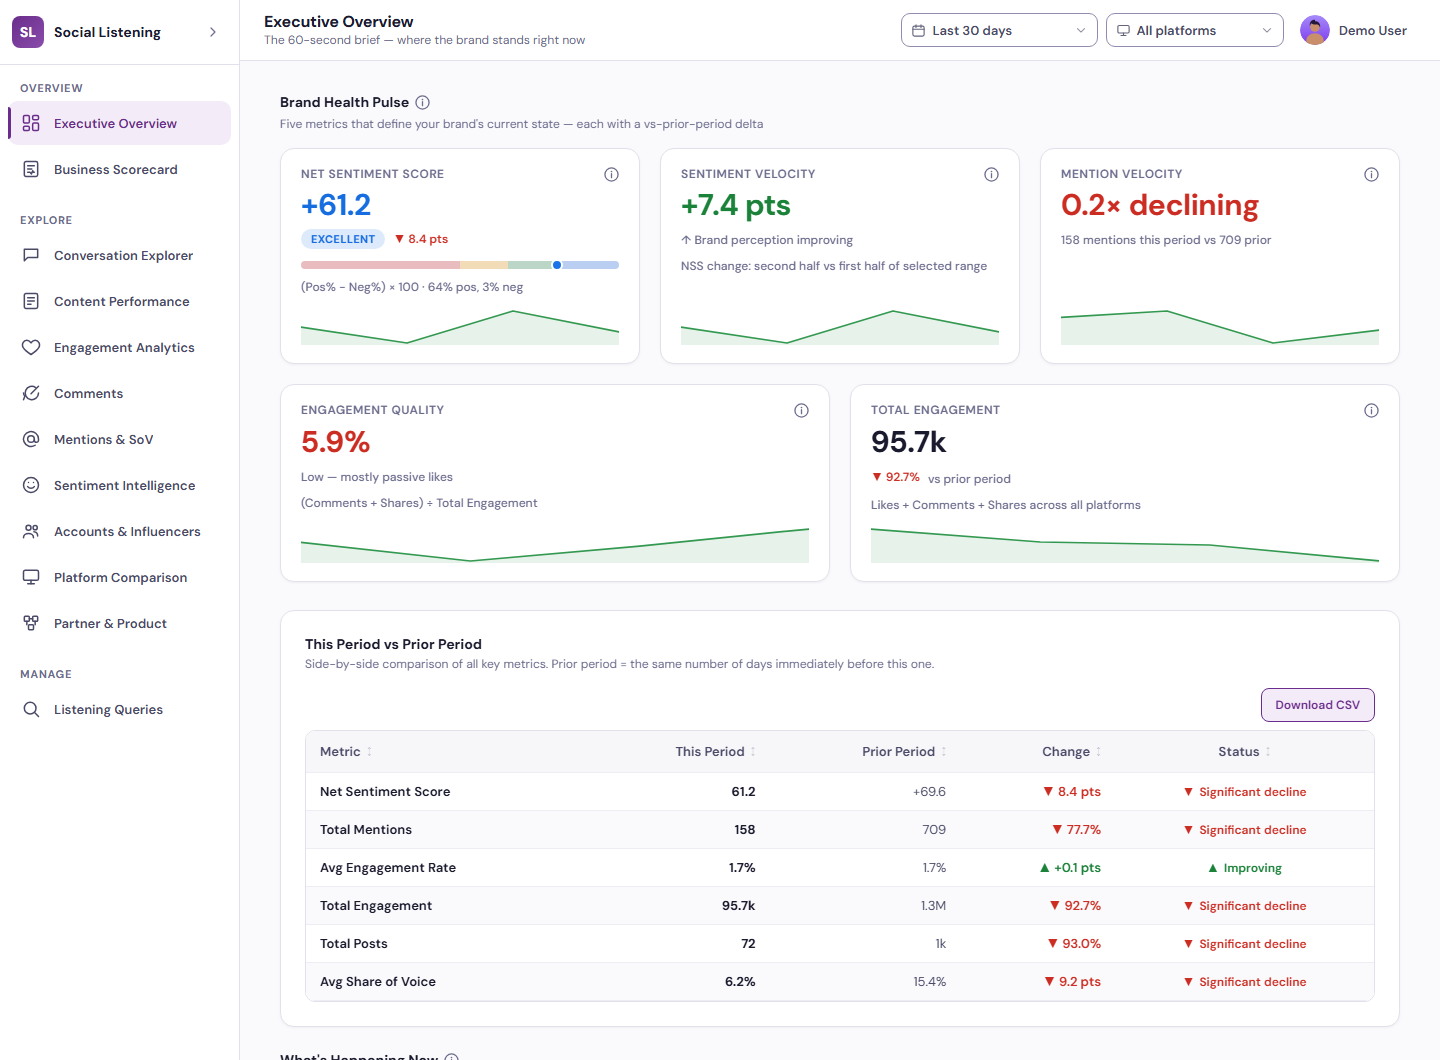
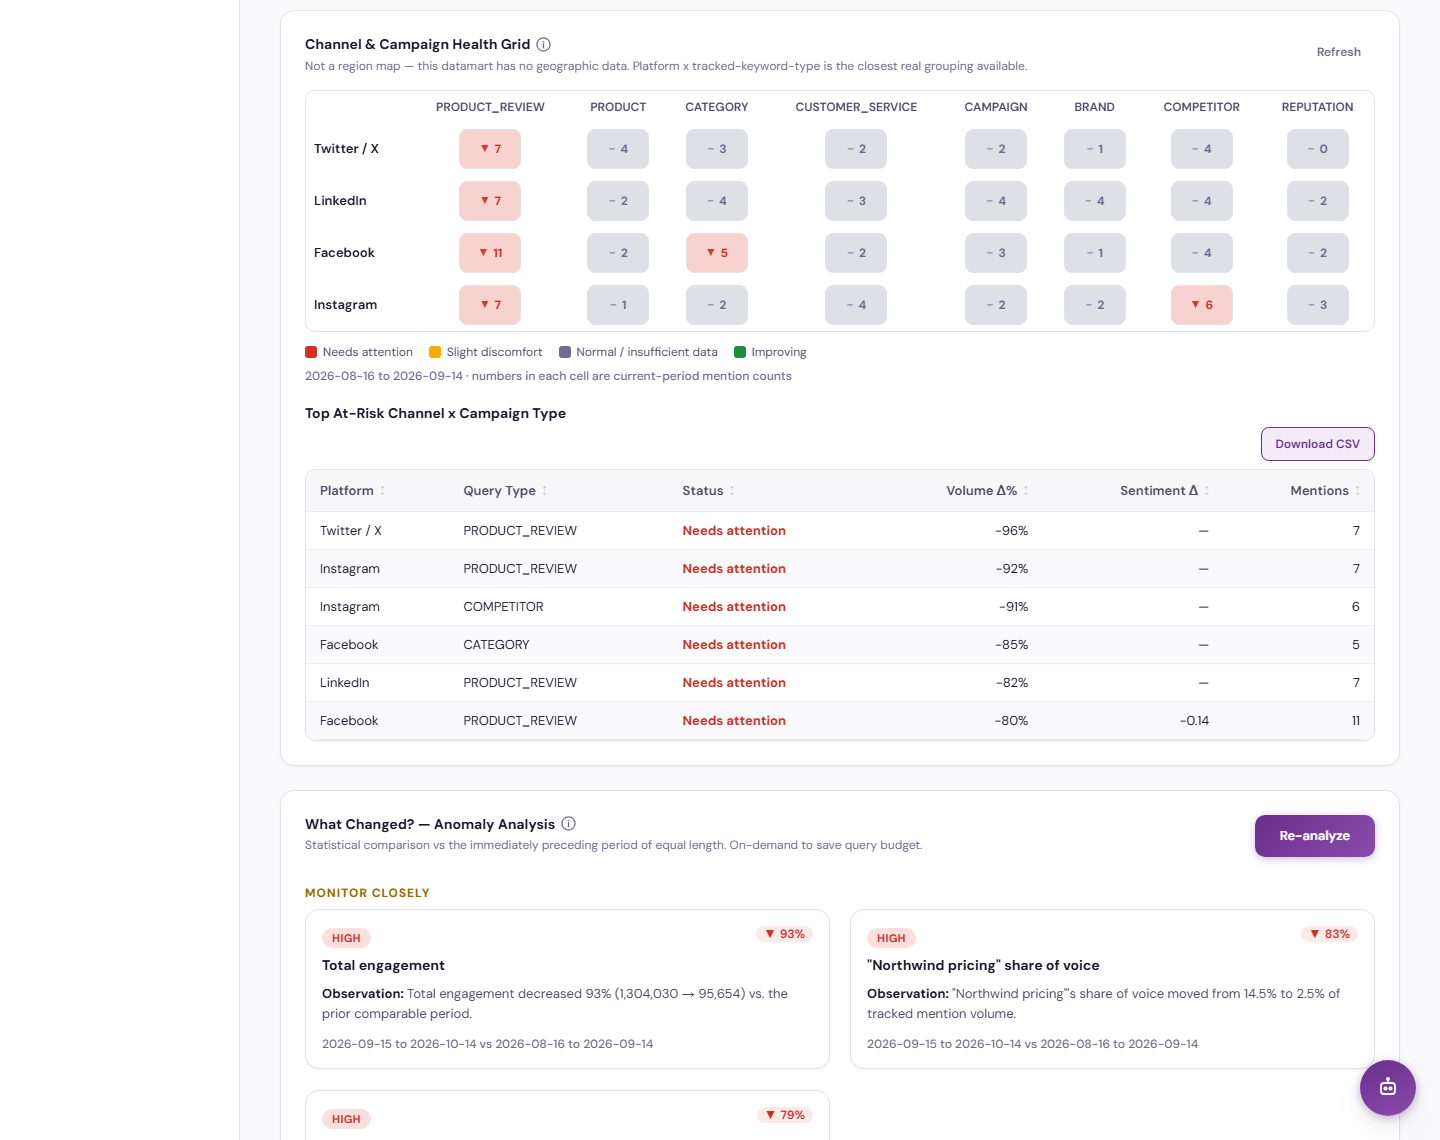
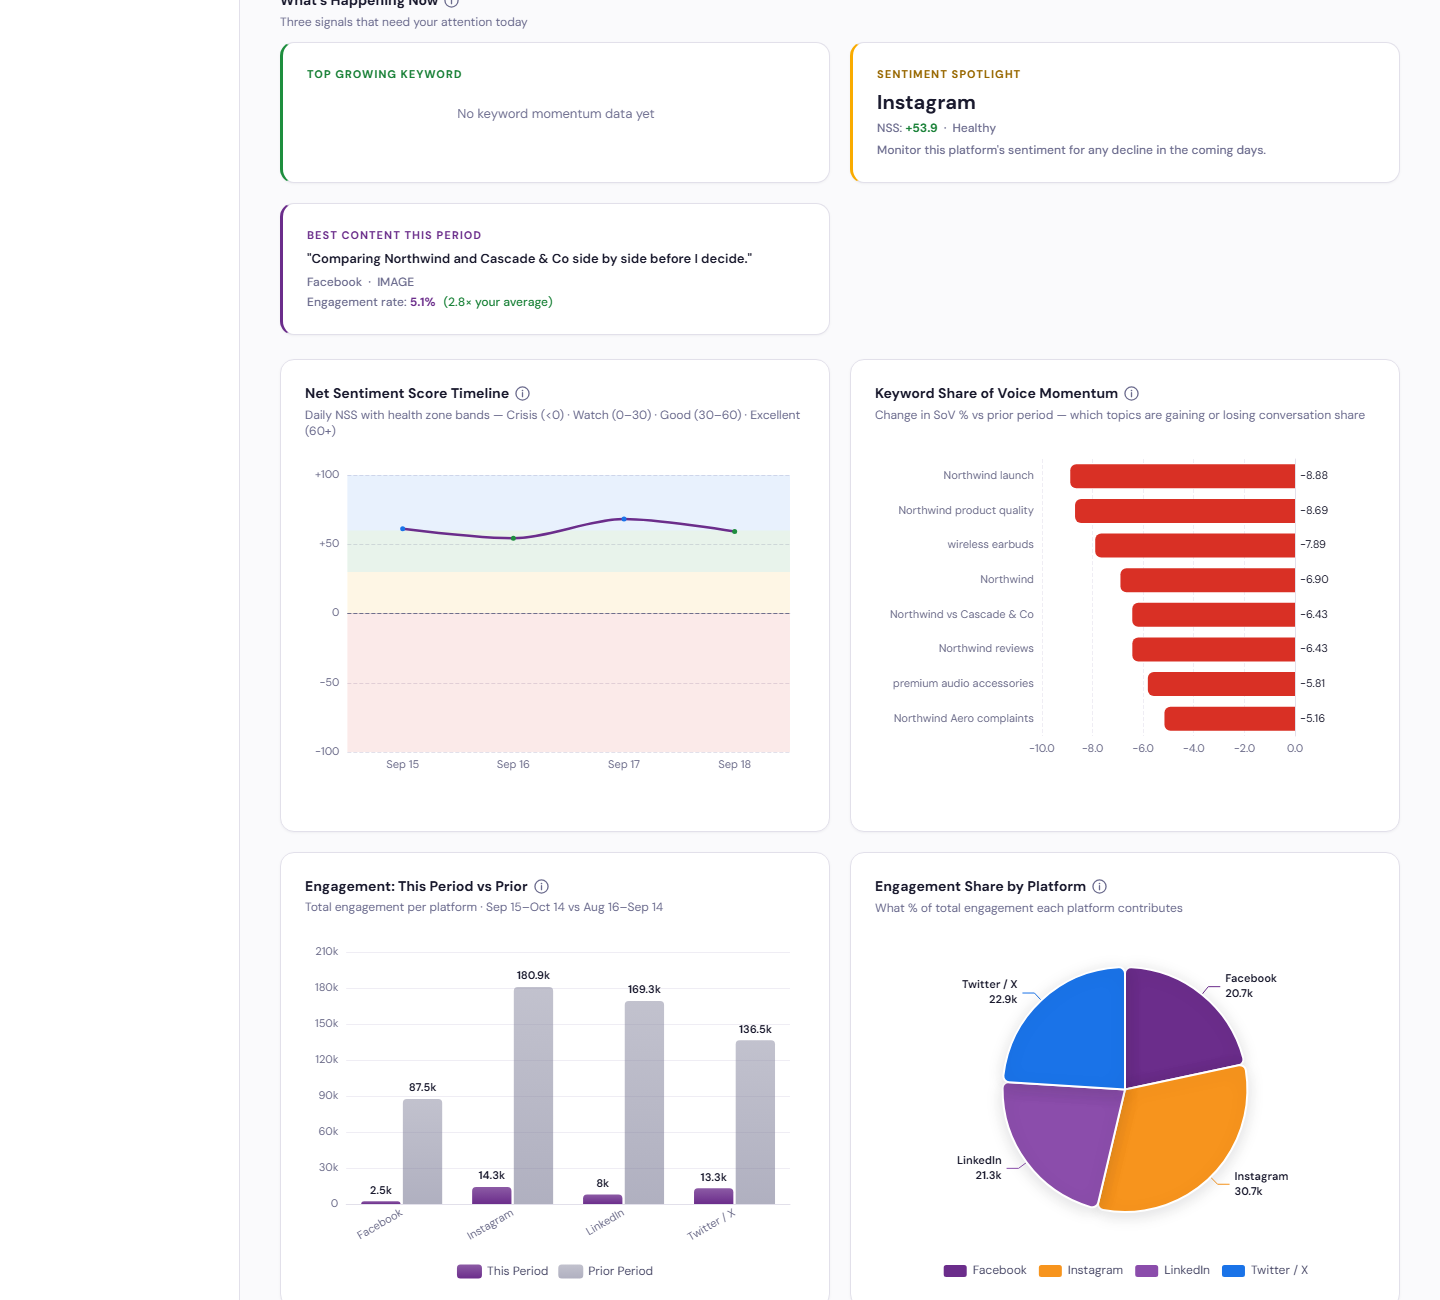
The Executive Overview opens with the Brand Health Pulse: Net Sentiment Score with an Excellent, Good, Watch or Crisis band, sentiment velocity, mention velocity, engagement quality and total engagement, each with its change against the prior period. A this-period-versus-prior table lines up every key metric, and What’s Happening Now surfaces the top growing keyword, a sentiment spotlight for one platform and the best content of the period. Below it, the NSS timeline, keyword share-of-voice momentum, engagement by platform and an on-demand channel and campaign health grid and anomaly analysis explain what changed and why.
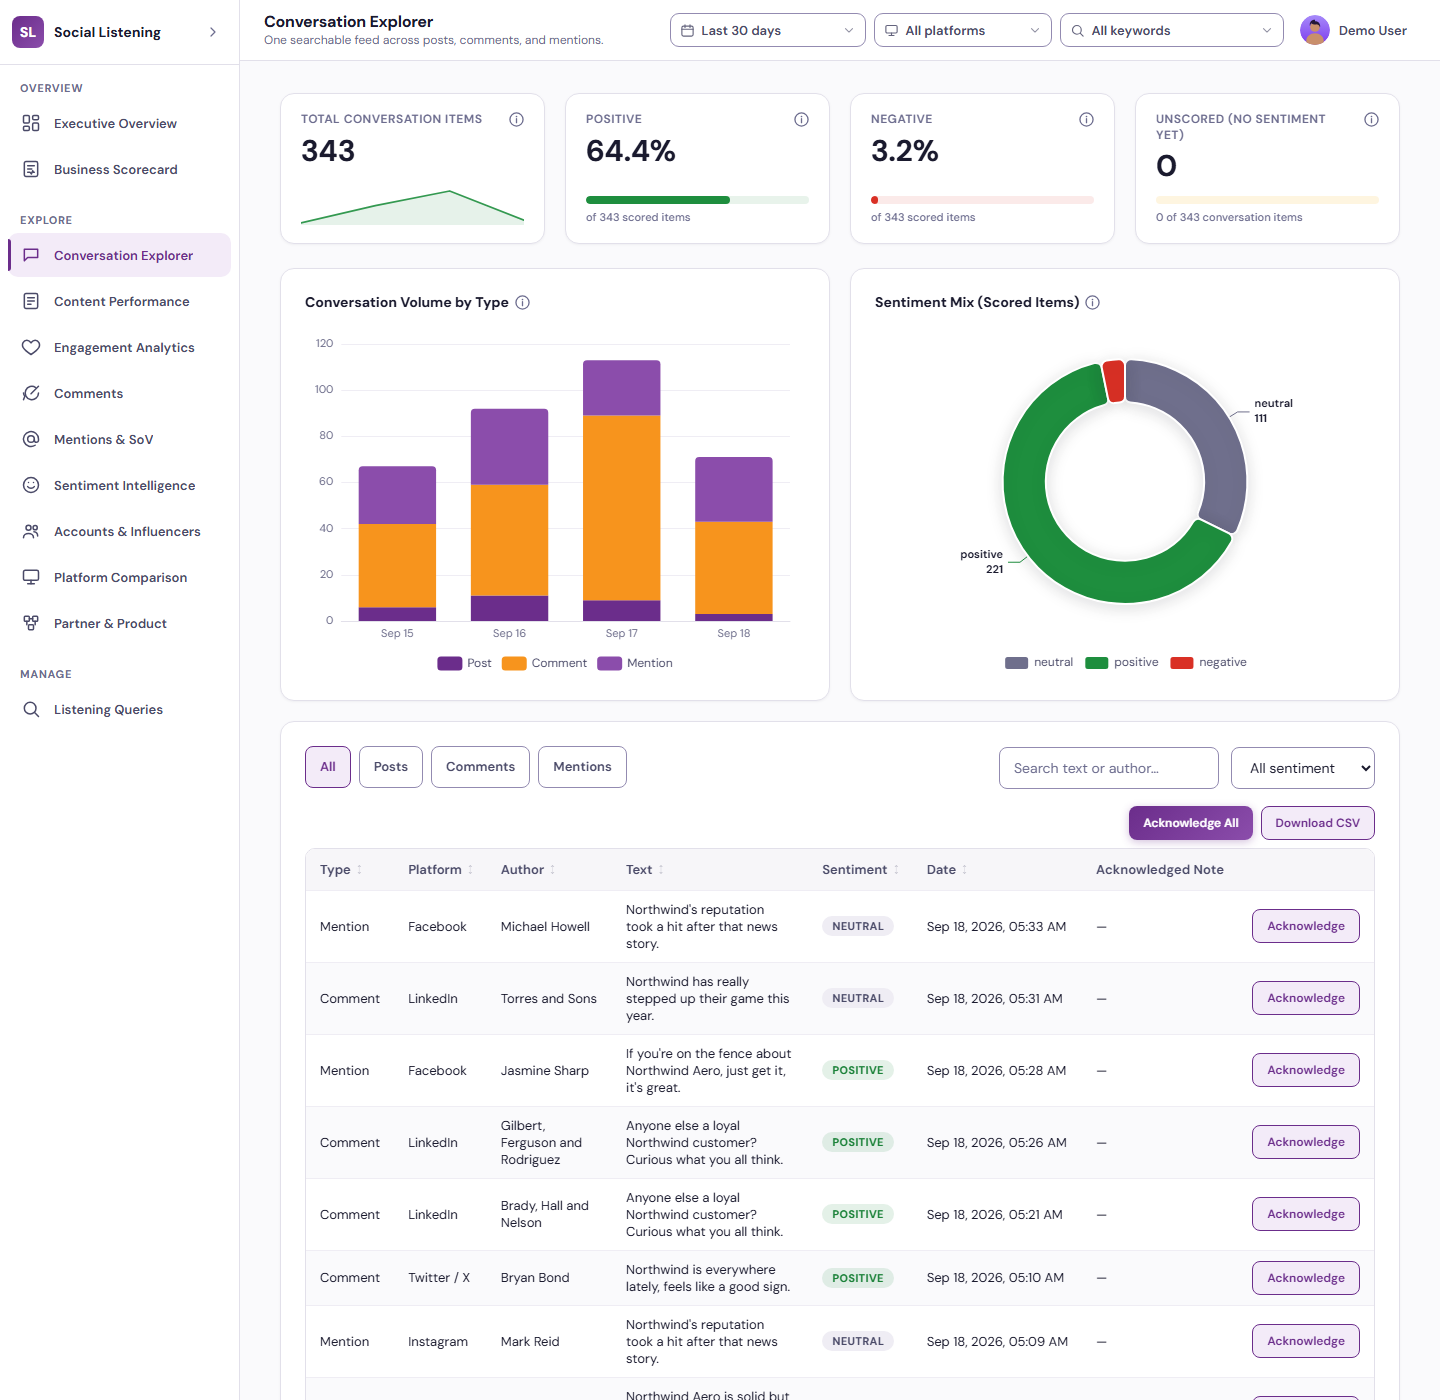
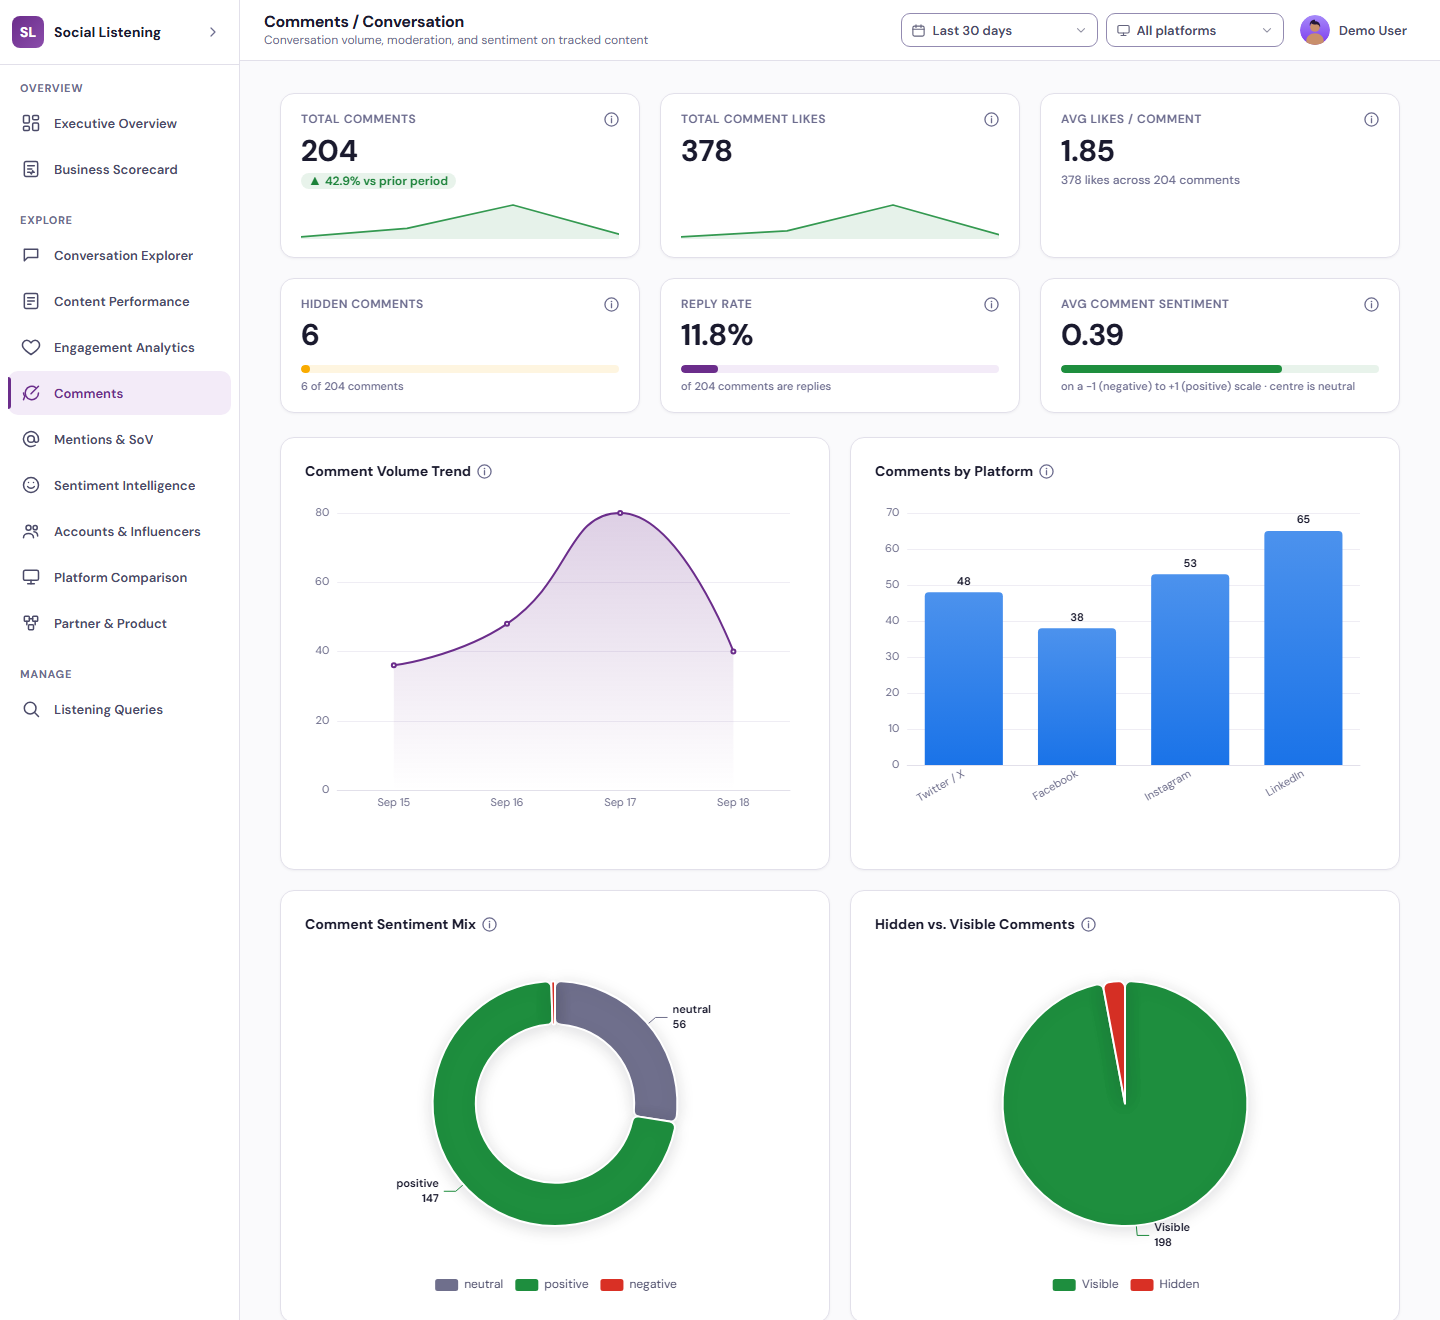
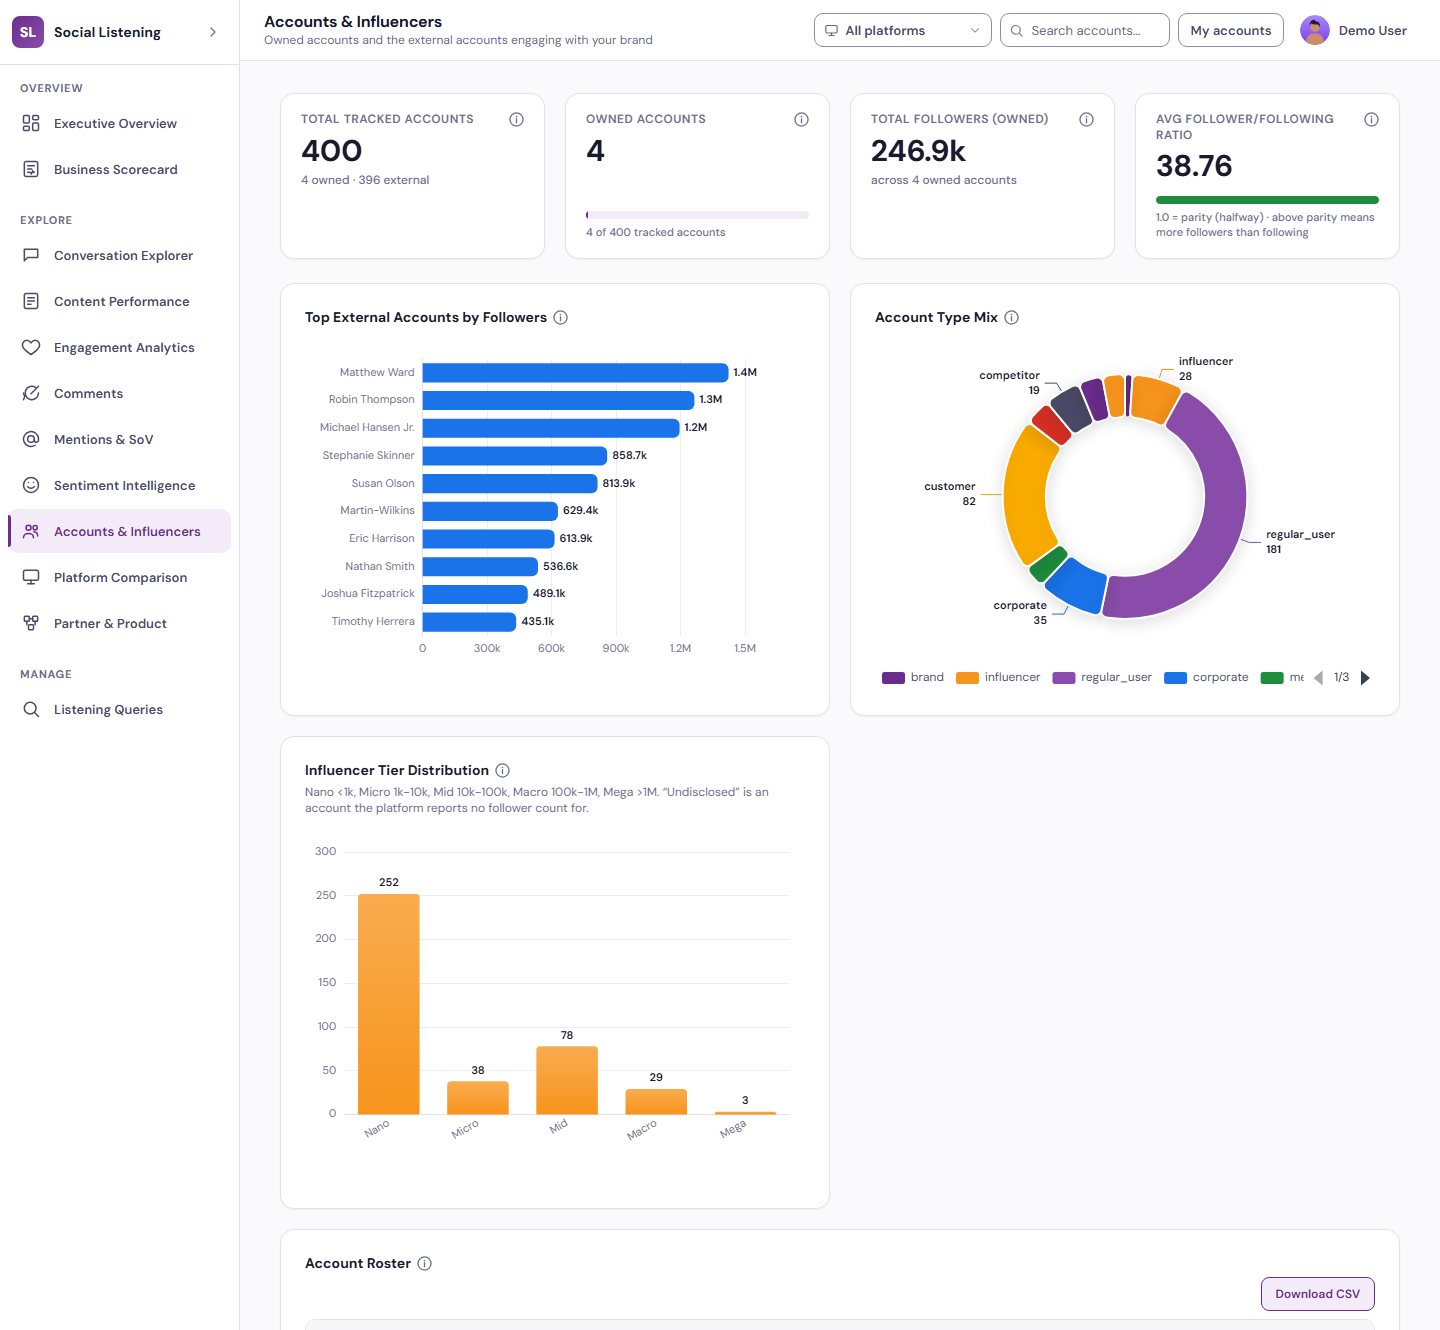
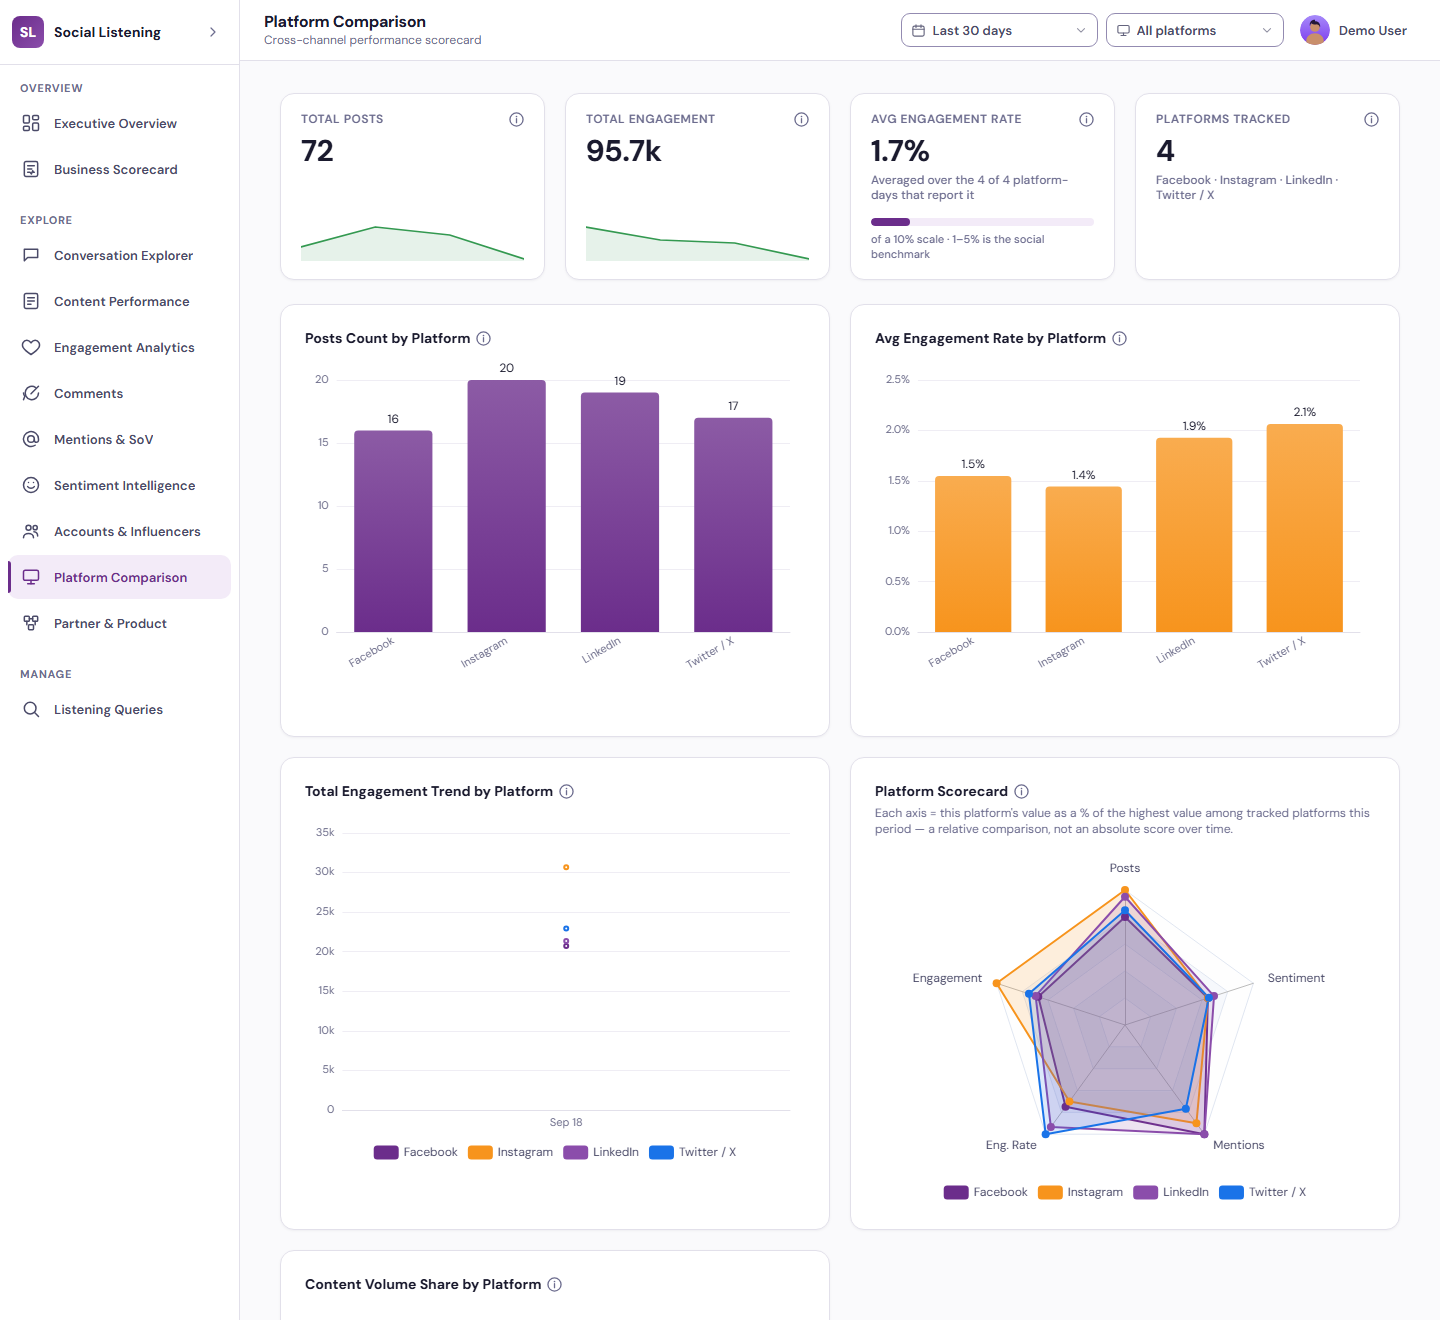
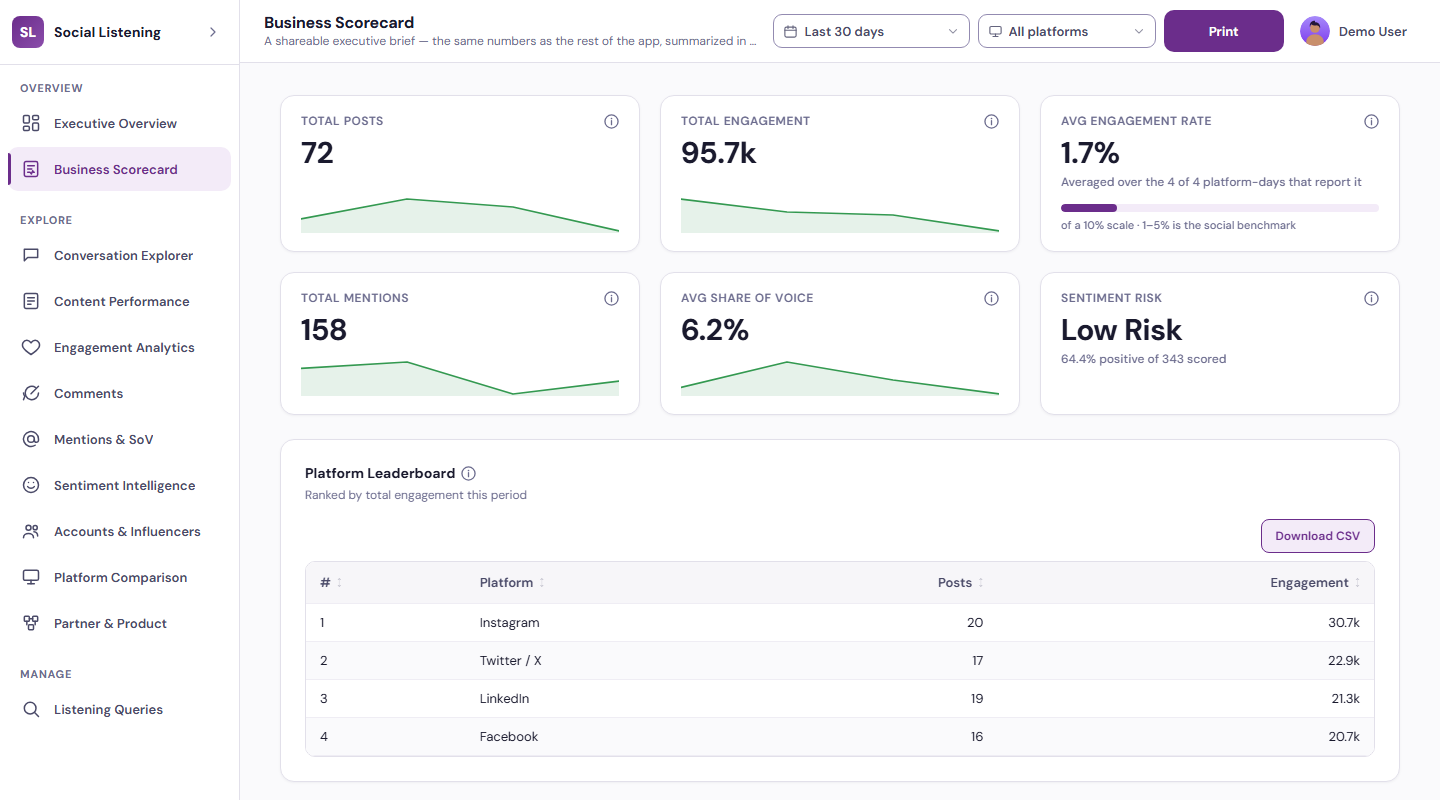
Eleven analytics views sit behind the overview, all filtered by date range, platform, keyword and own accounts: a searchable Conversation Explorer across posts, comments and mentions with sentiment and acknowledgement notes, Content Performance with an engagement funnel and a content quality matrix, Engagement Analytics with a best-time-to-post heatmap and audience advocates, Comments, Mentions and Share of Voice with anomaly detection, Sentiment Intelligence with a triage list of the most negative content, Accounts and Influencers with tiers, Platform Comparison, Partner and Product attribution and a printable Business Scorecard. Every table downloads to CSV. Everything runs on the BDB Platform.
- Net Sentiment Score, velocity and share of voice with change against the prior period
- One searchable feed of posts, comments and mentions with sentiment and acknowledgement
- Content, engagement, comment, mention, sentiment, account and platform analytics
- Tracked keywords for brand, competitors, campaigns, products and reputation managed in one list

What It Does
Executive Overview & Scorecard
A 60-second brief of brand health with Net Sentiment Score, velocity, share of voice and engagement, plus a printable Business Scorecard for leadership.
Explore Conversations
Ten analytics views across conversations, content, engagement, comments, mentions, sentiment, accounts, platforms and partner or product attribution, each with CSV download.
Manage Listening Queries
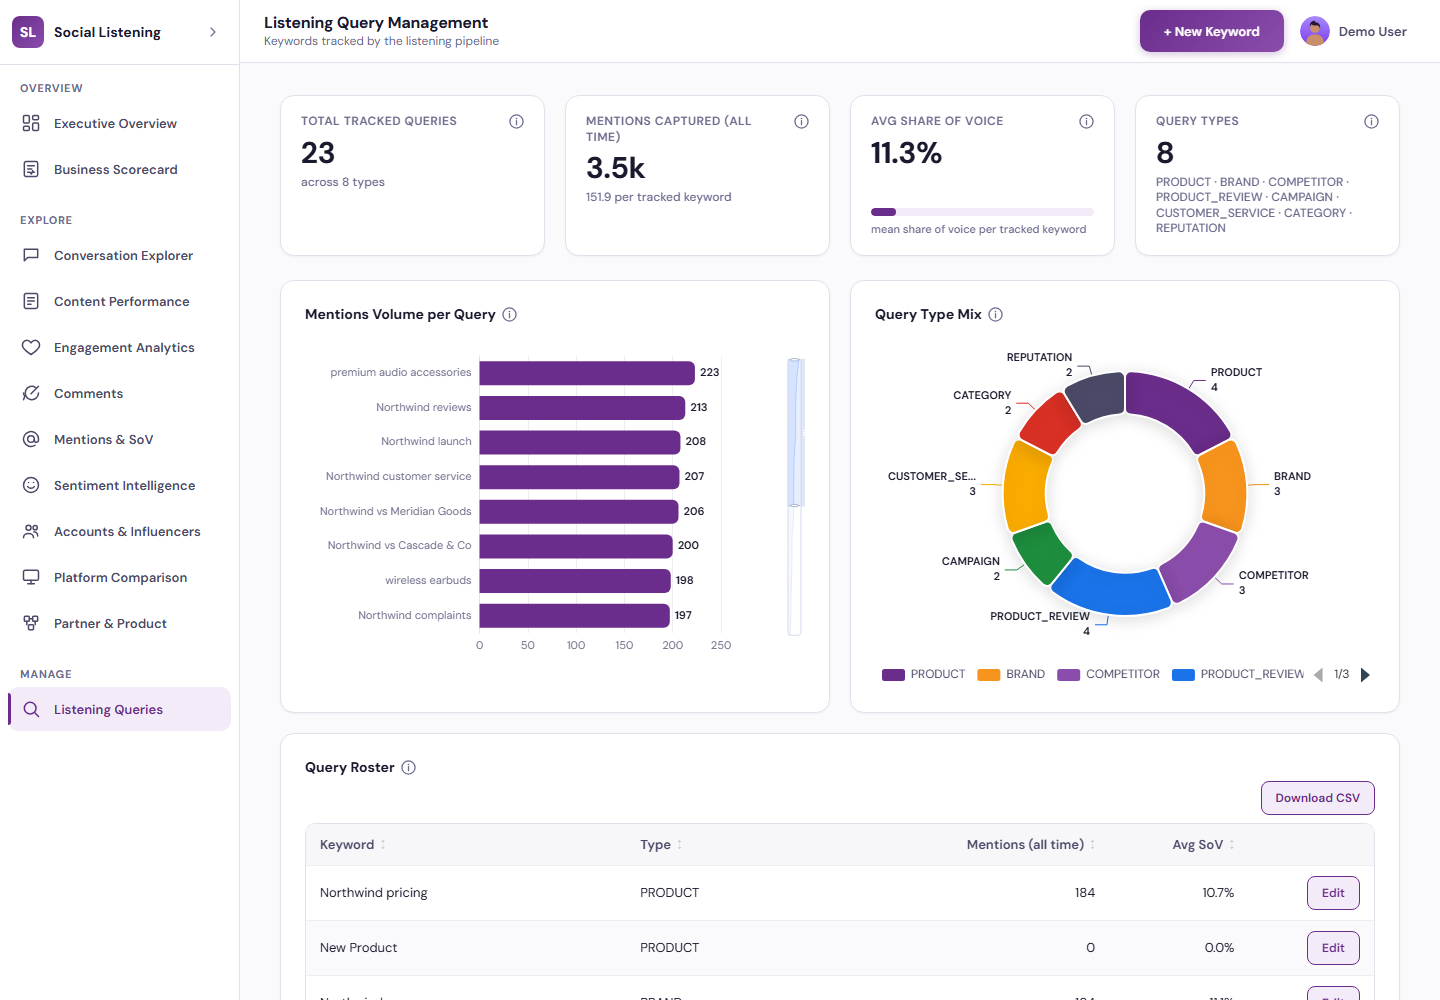
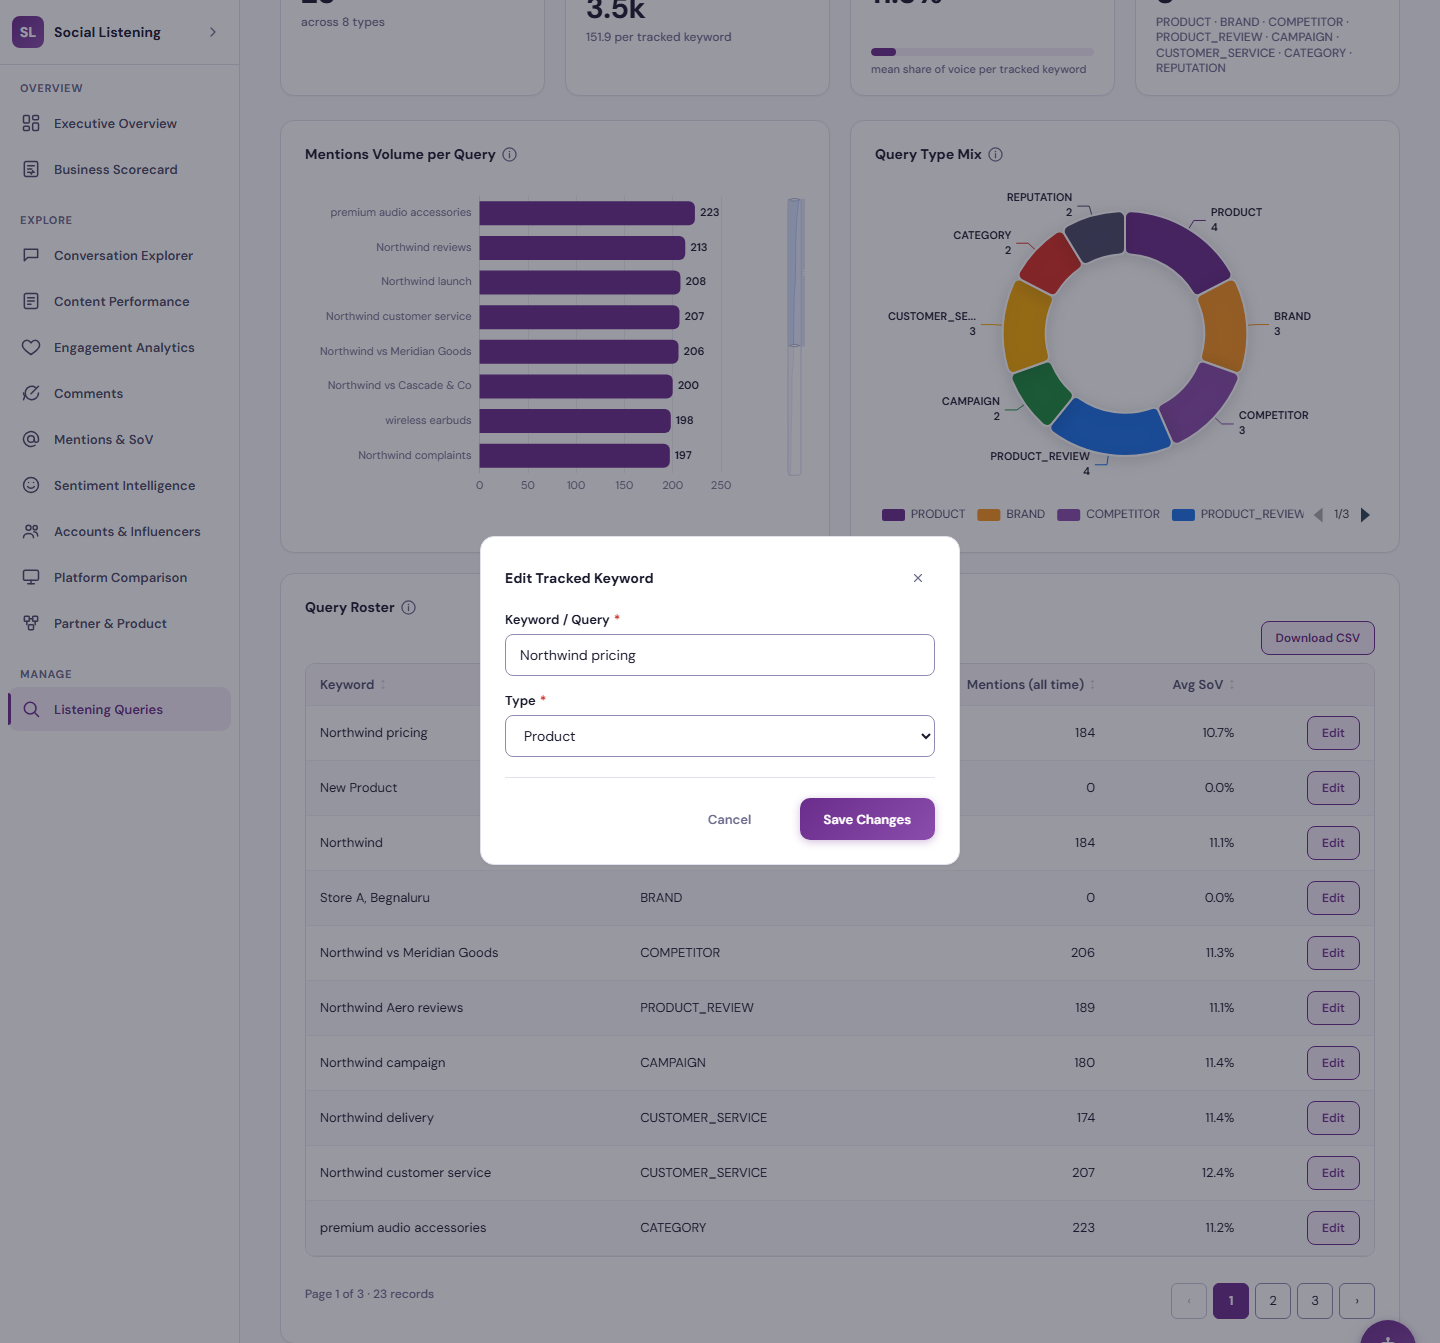
Tracked keywords by type: brand, competitor, product, product review, category, campaign, customer service and reputation, with mentions captured and average share of voice per keyword.
Who It Serves
Watch the conversation every day
- See the Brand Health Pulse and the three signals that need attention today
- Search one feed of posts, comments and mentions and acknowledge each item with a note
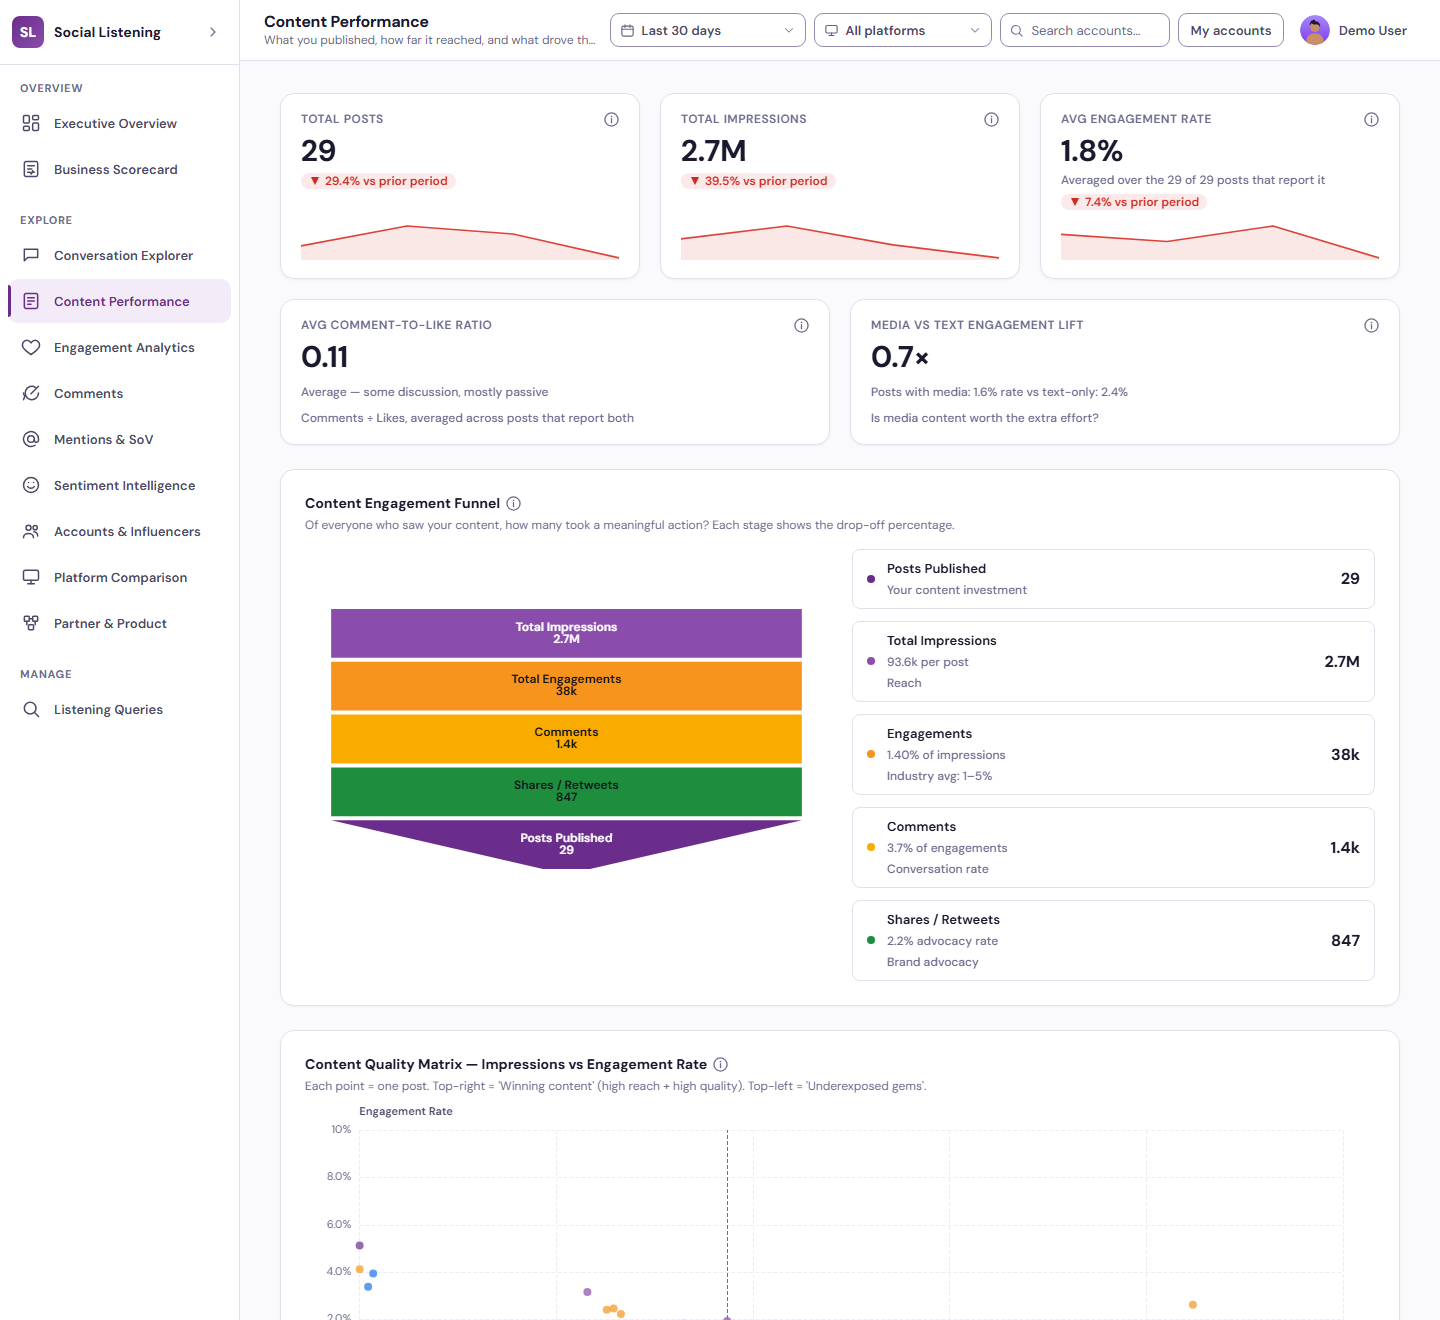
- Find the best-performing content and the formats worth repeating
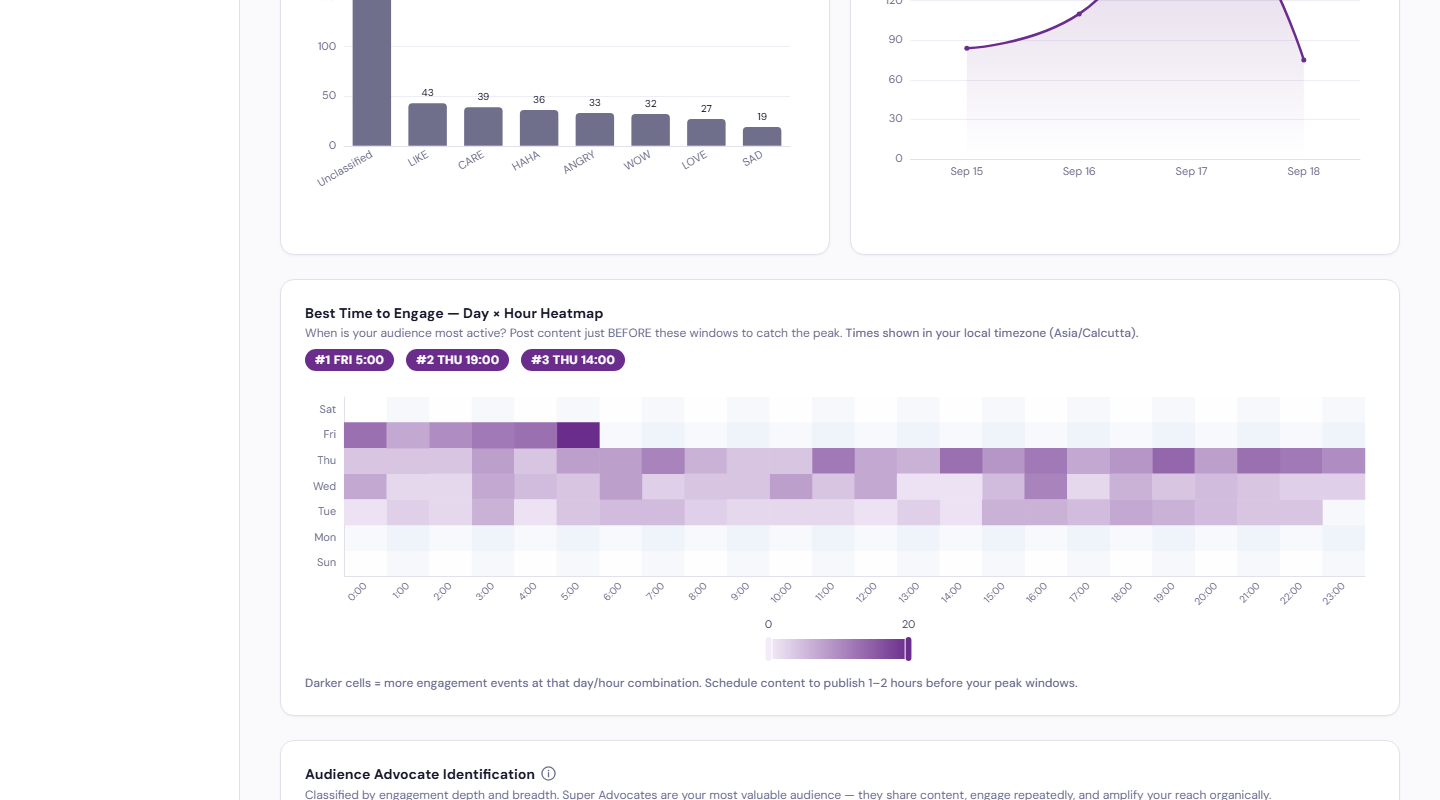
- Post before the peak windows shown in the day-by-hour engagement heatmap
- Identify advocates, active fans and top mentioning accounts
- Download any table to CSV for a campaign report
Know where the brand stands
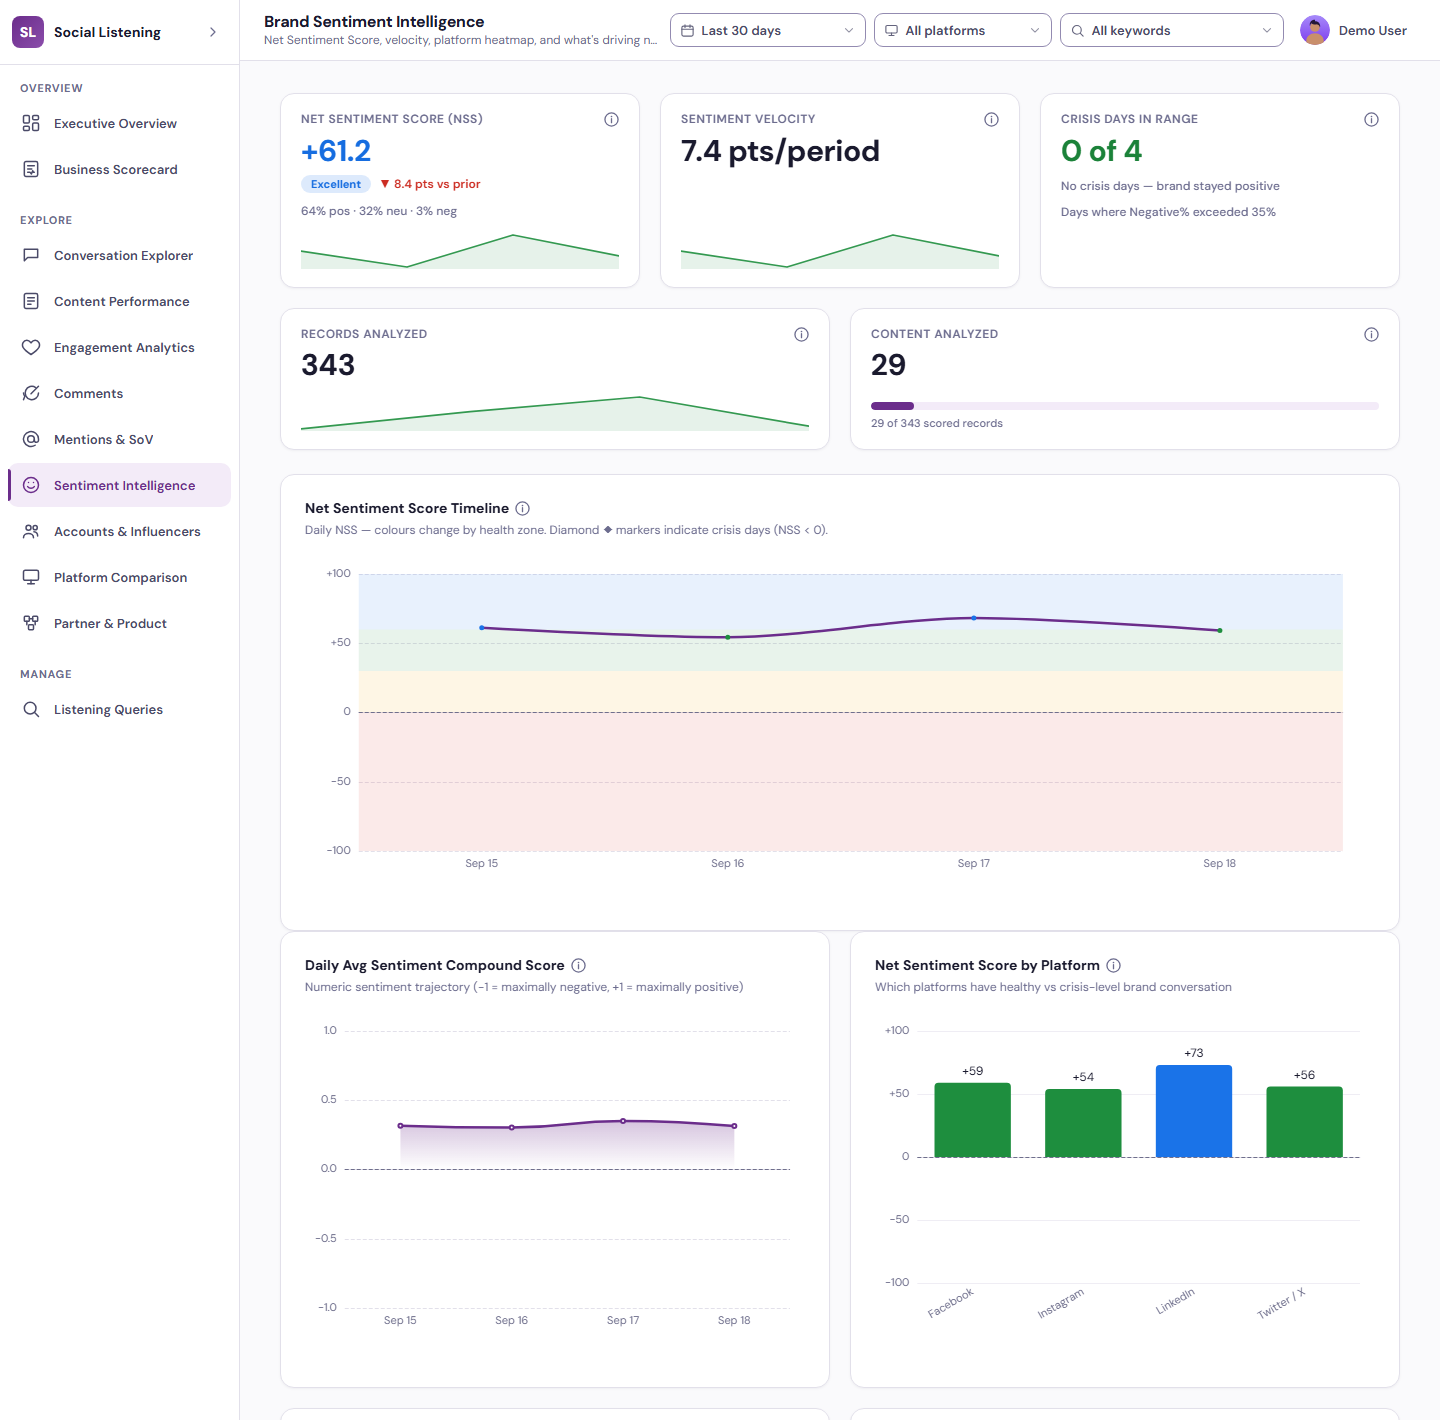
- Net Sentiment Score with Excellent, Good, Watch and Crisis zones
- Mention and sentiment velocity against the prior period
- Share of voice for admissions campaigns, programmes and competitor names
- Platform leaderboard and why each platform ranks where it does
- Anomaly analysis of what changed and how much
- A printable Business Scorecard with the same numbers as the rest of the app
Catch issues before they spread
- Crisis days flagged when negative share exceeds the threshold
- Triage list of the most negative content with comment counts
- Sentiment by platform, tracked keyword and conversation type
- Hidden versus visible comments and reply rate
- Channel and campaign health grid marking what needs attention
- Customer service and reputation keywords tracked alongside the brand
How It Works
From tracked keyword to action in four steps
The team defines the keywords to listen for: the institution’s name, programmes, campaigns, competitor institutions and reputation terms. The listening pipeline captures posts, comments, mentions and reviews from the connected platforms and scores each one for sentiment. The analytics views show what is happening, what changed and what to do, and the team acknowledges conversations, triages negative content, downloads the data and shares the scorecard.
Track
Add tracked keywords by type: brand, competitor, product, campaign, customer service, category or reputation.
Capture
Posts, comments, mentions and reviews are collected from Instagram, X, Facebook, LinkedIn and review sites and scored for sentiment.
Analyse
Executive Overview and eleven analytics views filtered by date range, platform, keyword and own accounts.
Act
Acknowledge conversations, triage negative content, load the health grid and anomaly analysis, download CSV and print the scorecard.
Benefits and Features
Net Sentiment Score
(Positive % minus Negative %) with Excellent, Good, Watch and Crisis zones, a daily timeline, velocity and crisis-day counts.
Share of Voice
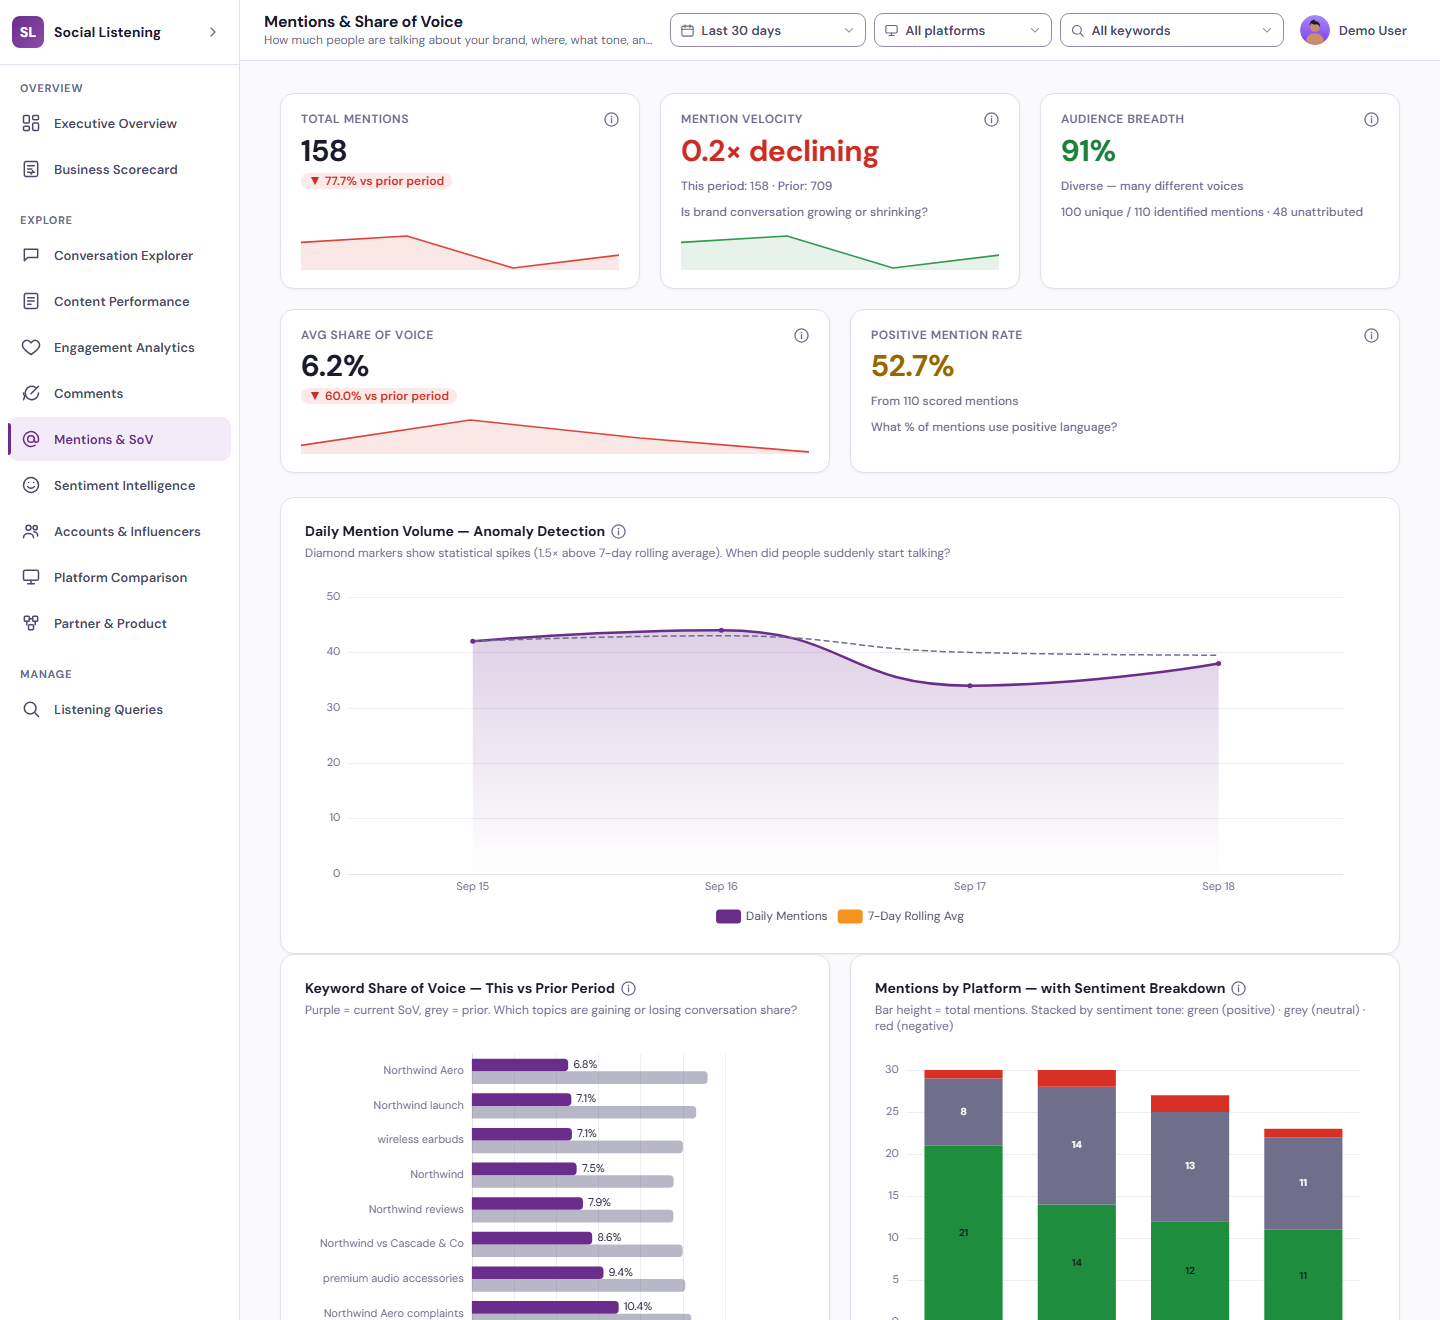
Mention share per tracked keyword, this period versus prior, with momentum showing which topics gain or lose conversation share.
Conversation Explorer
One searchable feed of posts, comments and mentions with platform, author, sentiment, date, acknowledgement and notes.
Content Performance
Impressions, engagement rate, comment-to-like ratio, media versus text lift, an engagement funnel, quality matrix, decay curve and top posts.
Best Time to Engage
A day-by-hour engagement heatmap in the team’s own time zone with the top three posting windows.
Advocates & Influencers
Super advocates, active fans and casual engagers, tracked accounts by type and influencer tier from nano to mega.
Anomaly Detection
Statistical spikes in daily mentions, a what-changed analysis against the prior period and a channel and campaign health grid.
Sentiment Intelligence
Sentiment by platform, keyword and record type, a platform-by-type heatmap and a triage list of the most negative content.
Scorecard & CSV Export
A printable Business Scorecard for leadership and a CSV download on every table in the app.
Platform Screens
Three Ways In, One Platform
Leadership
Open the Executive Overview and the Business Scorecard for the 60-second brief on where the brand stands and what changed.
Marketing & Communications
Work through conversations, content, engagement, comments, mentions and sentiment every day, acknowledge items and download the data.
Administrators
Manage the tracked keywords, tag the institution’s own accounts and set account types so the analytics stay relevant.
Tailored to Your Institution
Flexible by design
The solution provides flexibility to tailor components to the institution’s own identity and requirements. Logo, branding, colour theme, communication style, terminology, workflows and other institution-specific requirements can be customised if required.
Every element seen in the demo is a starting point. Yujaa configures the solution around how your marketing and communications team already works, so everyone experiences a platform that feels like their own.
Logo & Branding
Institution logo, name and visual identity across every portal and email.
Colour Theme
Palette and styling aligned to the institution’s brand guidelines.
Communication & Terminology
Email tone, labels and terms matched to how the institution speaks.
Workflows
Approval steps, forms and role permissions set to local requirements.
Ready to Hear What People Say About Your Institution?
Walk through the Executive Overview, the analytics views and listening query management with the Yujaa team. Built and hosted on the BDB Platform.