

Teacher Observation Tracker
Lesson Observations & Weekly Teaching KPIs
The Teacher Observation Tracker gives senior leaders one place to record what they see in classrooms and one report that tells the school how teaching is going. Each observation rates items across three weighted domains, Classroom Environment and Management, Academic Performance and Professional Development Targets, on a scale from Weak to Outstanding, then adds a work scrutiny of student notebooks and an agreed area of improvement. Every week the tracker produces the KPI report on the share of lessons judged Good or better, a detailed report with grid, graph and teacher views, and the lists of classes targeted for improvement and teachers who need support.
Solution Overview
From a single lesson to the whole-school picture
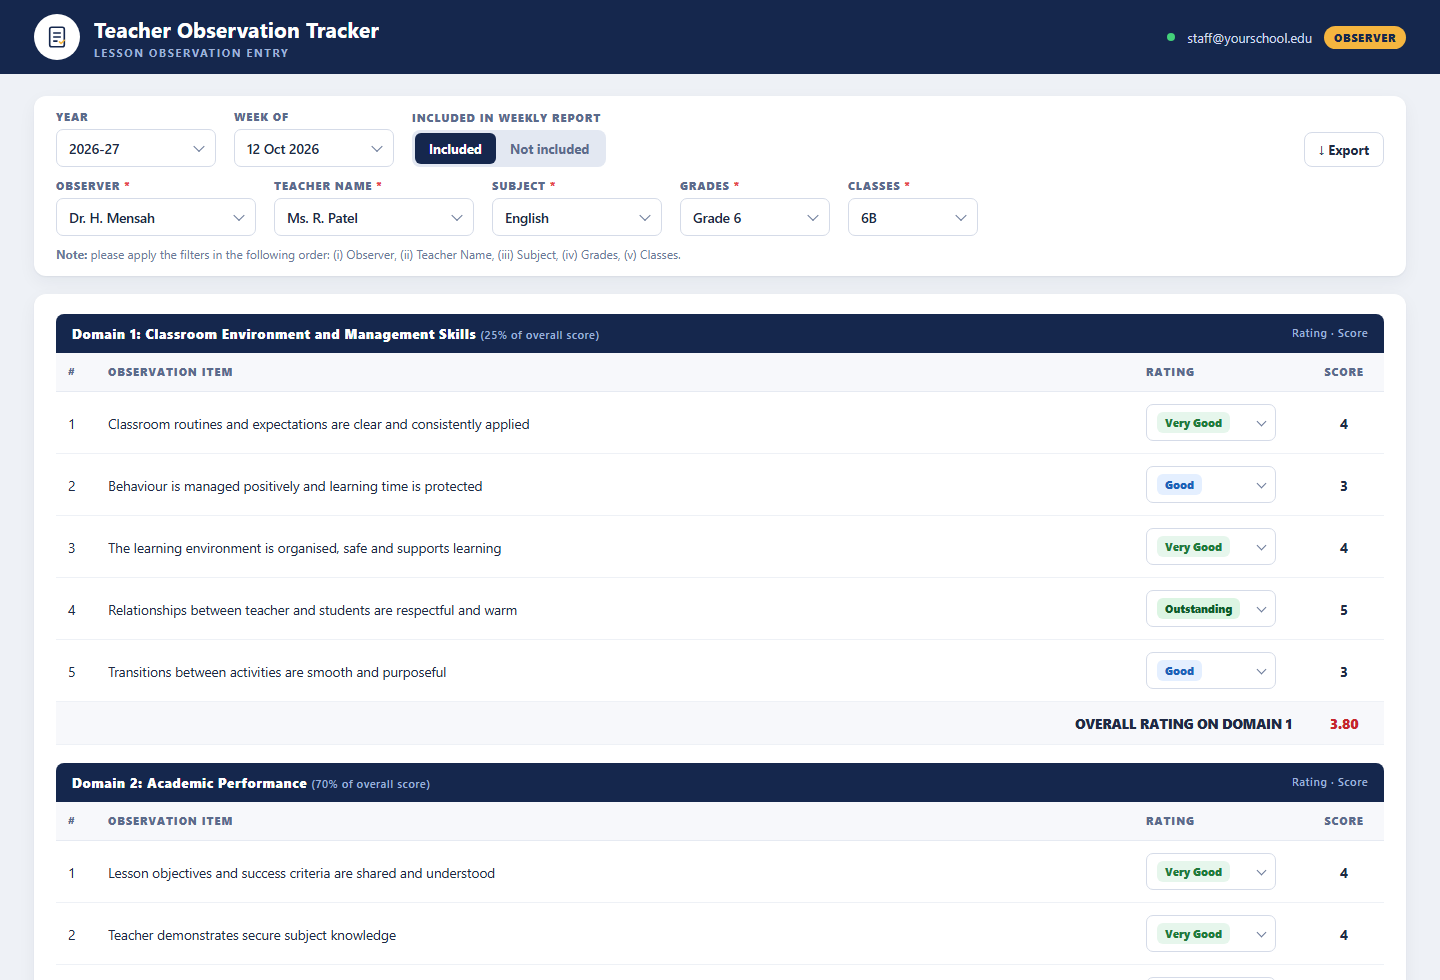
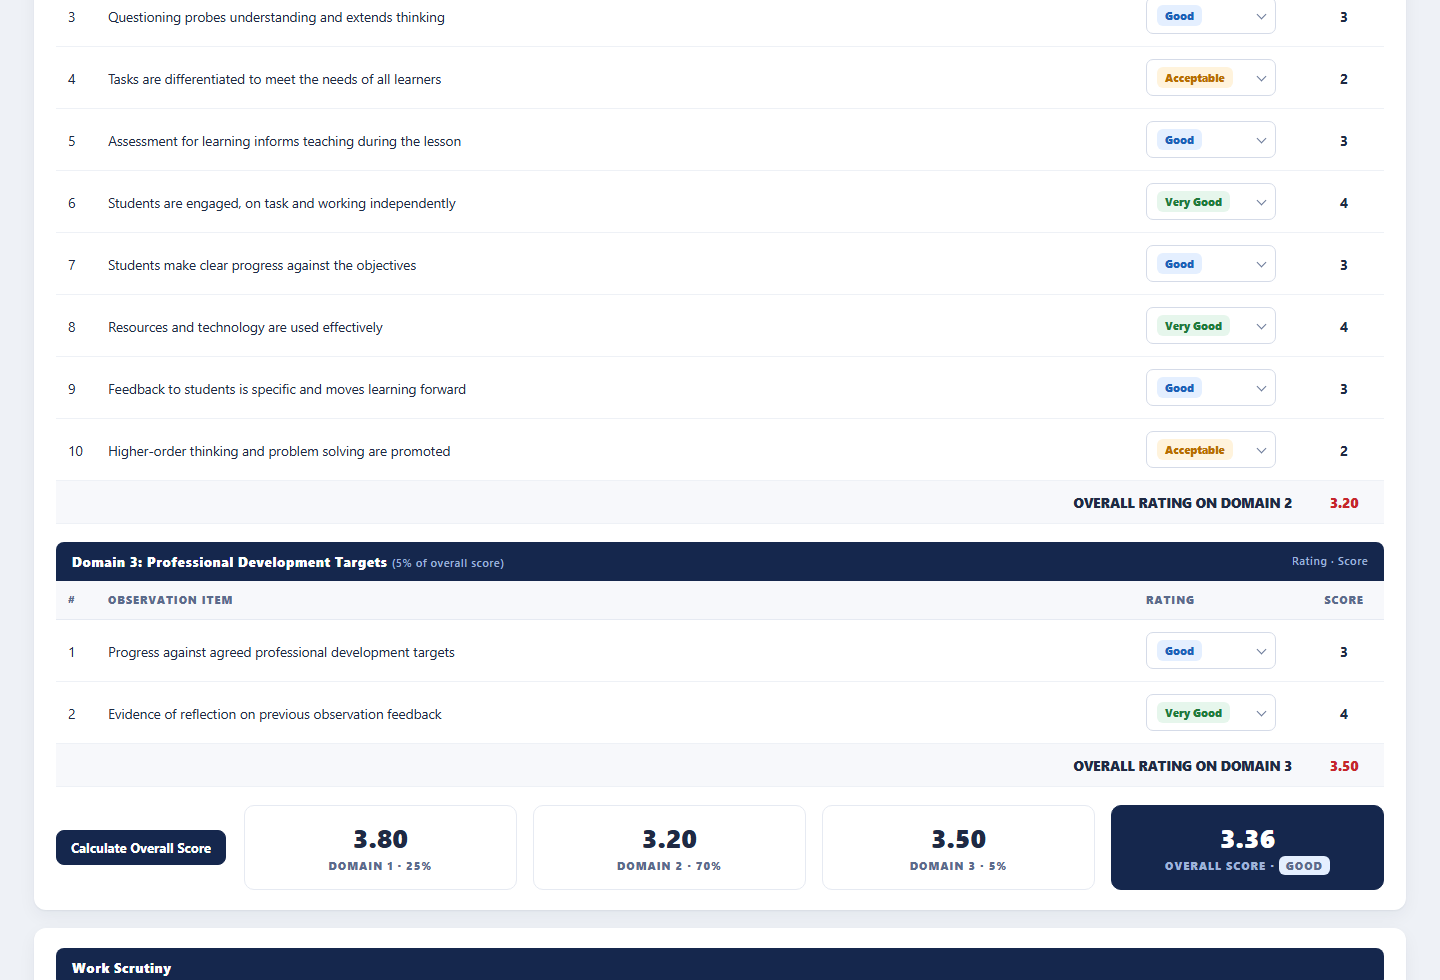
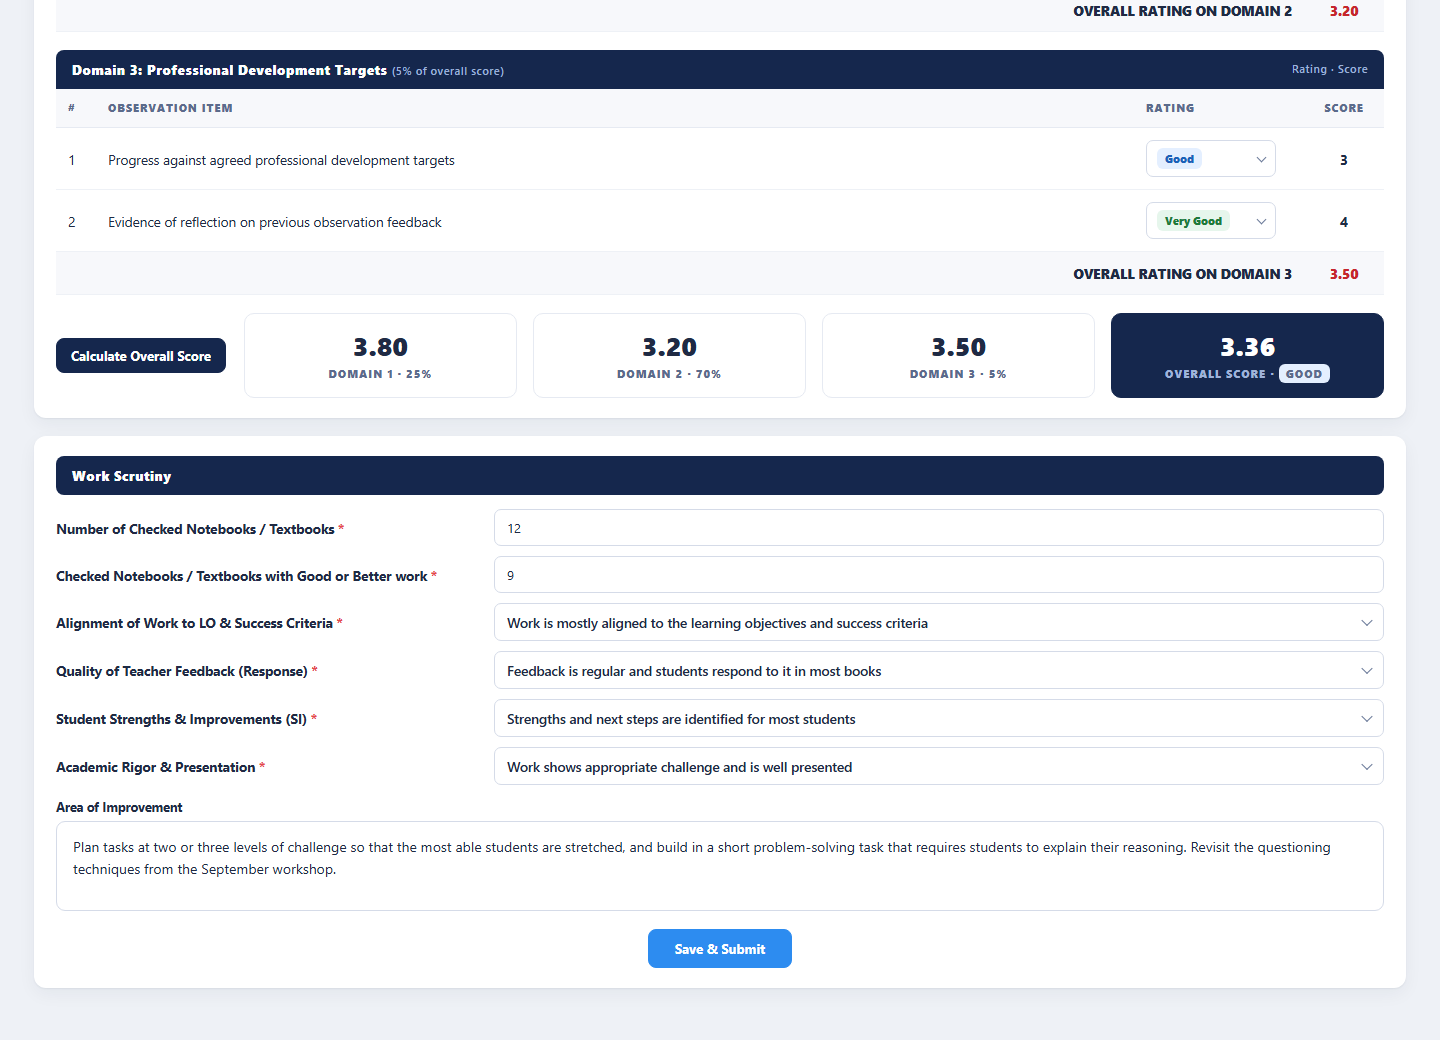
An observer selects the teacher, subject, grade and class for the week and works through the observation form. Domain 1, Classroom Environment and Management Skills, carries 25% of the score; Domain 2, Academic Performance, carries 70%; Domain 3, Professional Development Targets, carries 5%. Each item is rated N/A, Weak, Acceptable, Good, Very Good or Outstanding, scored 1 to 5, and the tracker calculates the domain averages and the weighted overall score. A work scrutiny records how many notebooks were checked, how many showed good or better work, and judgements on alignment to learning objectives, quality of teacher feedback, student strengths and improvements, and academic rigour and presentation. An area of improvement is agreed and the observation is saved and submitted, or reopened later to be edited.
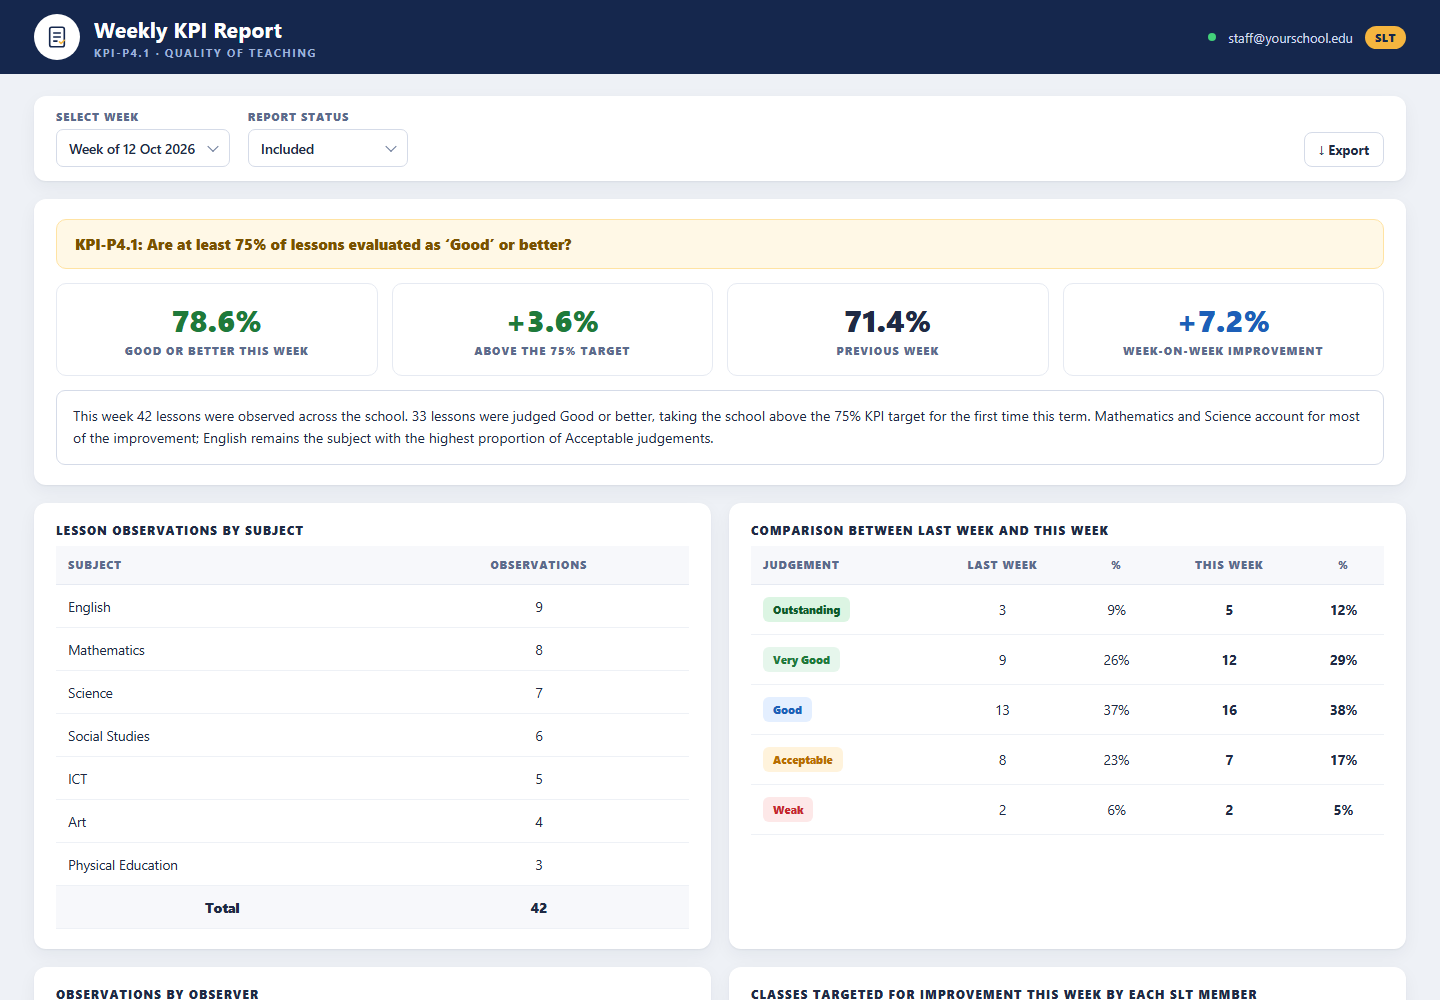
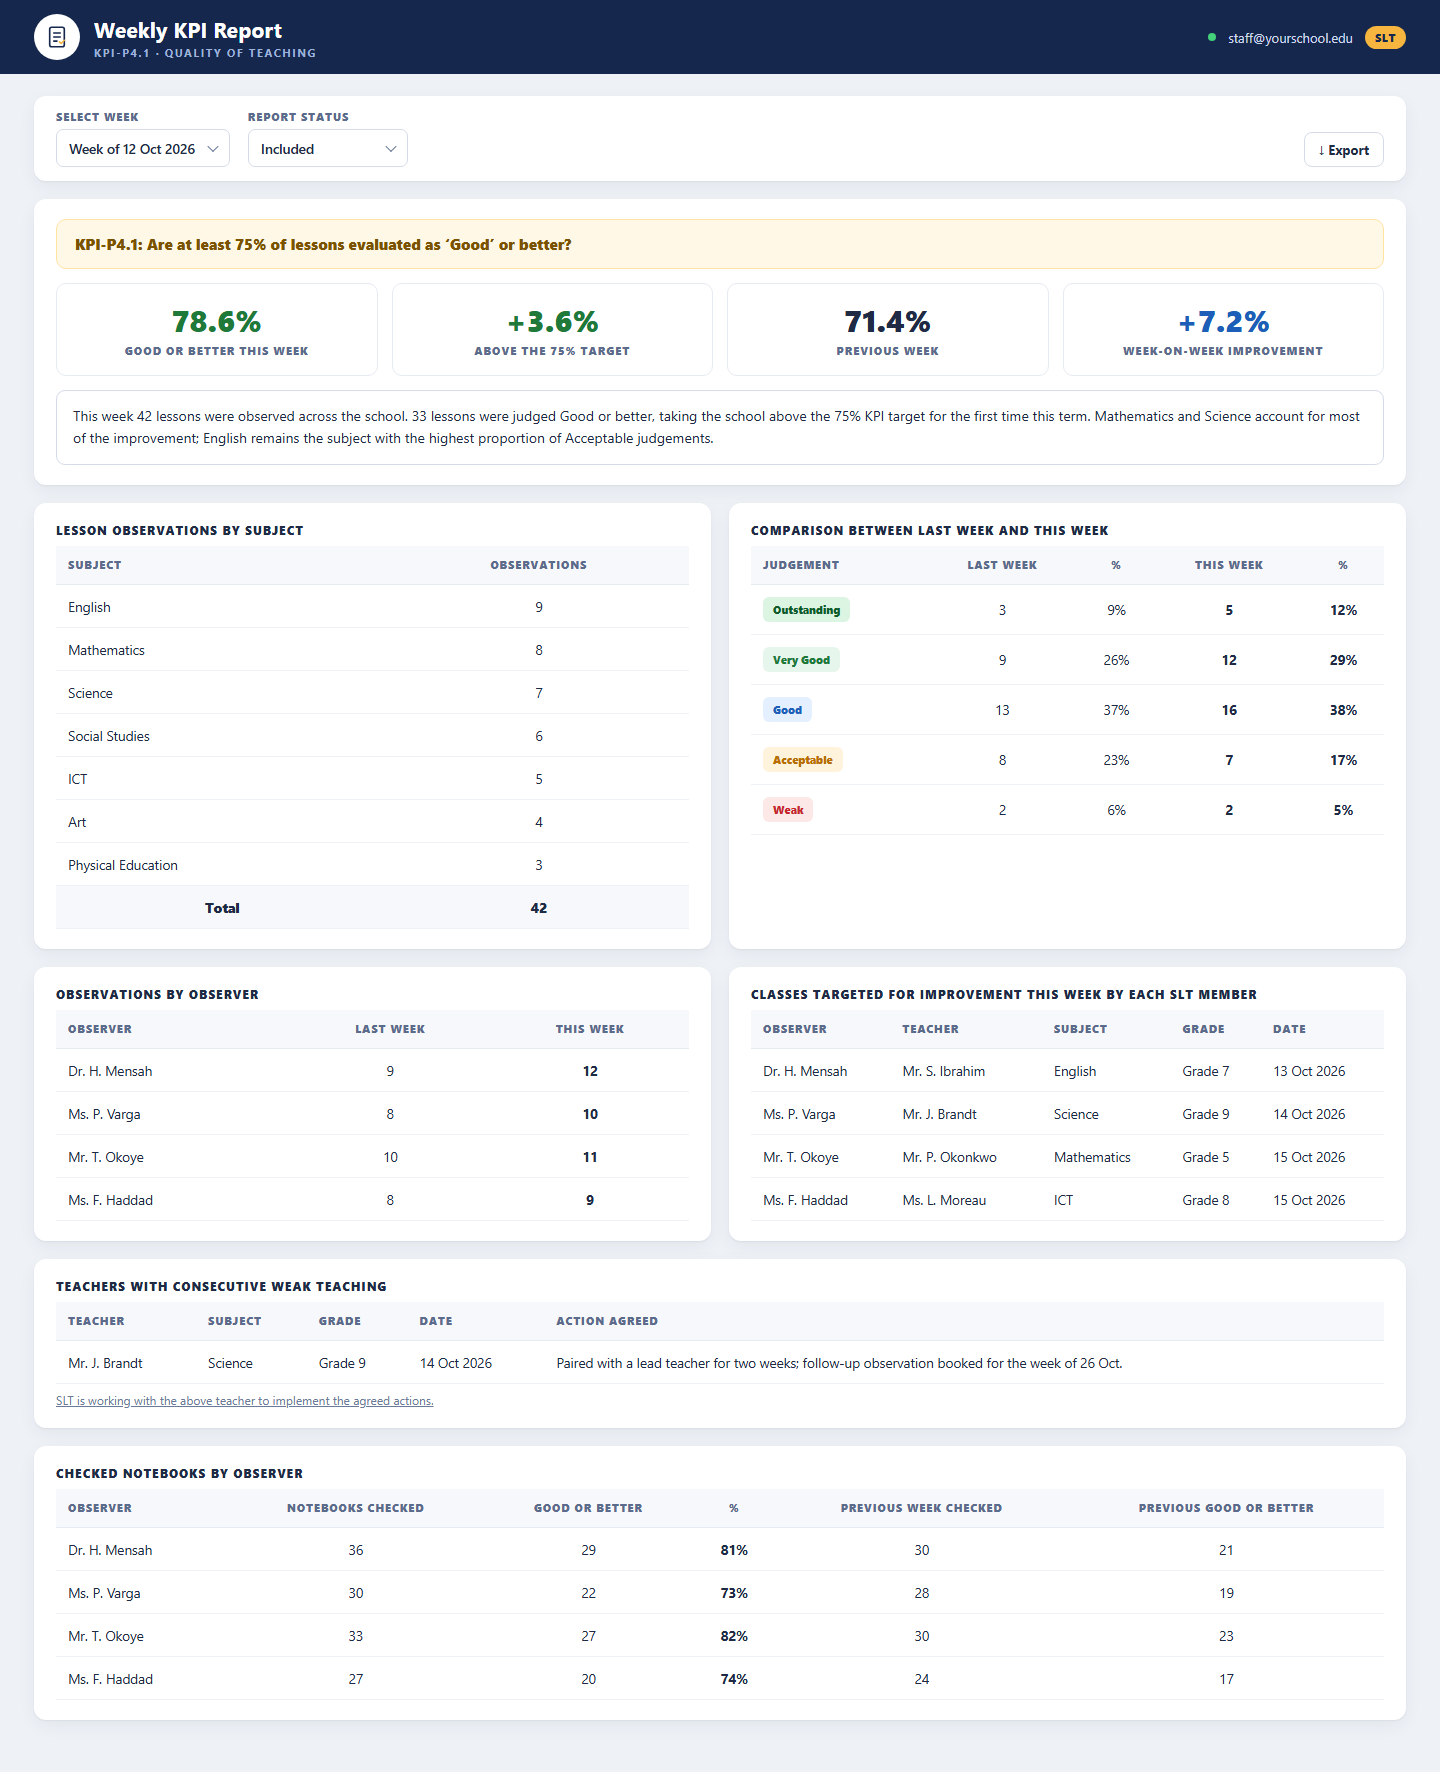
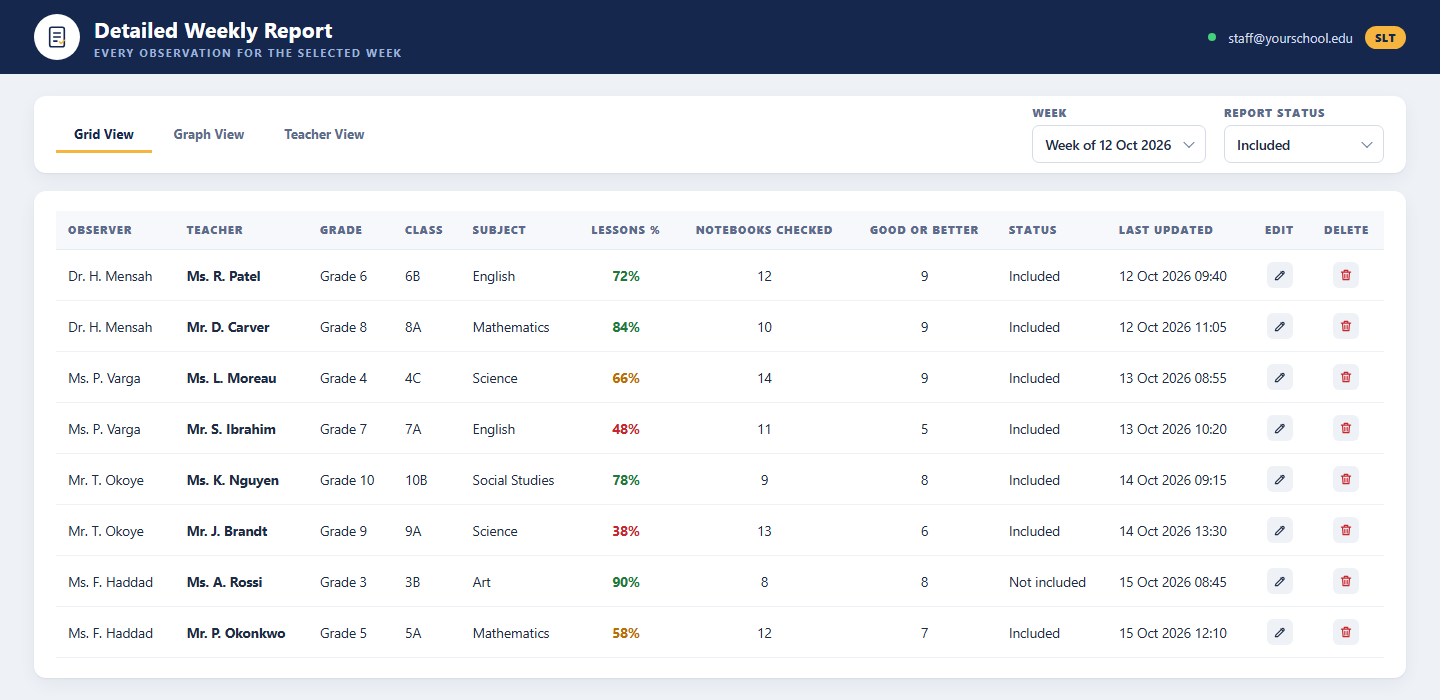
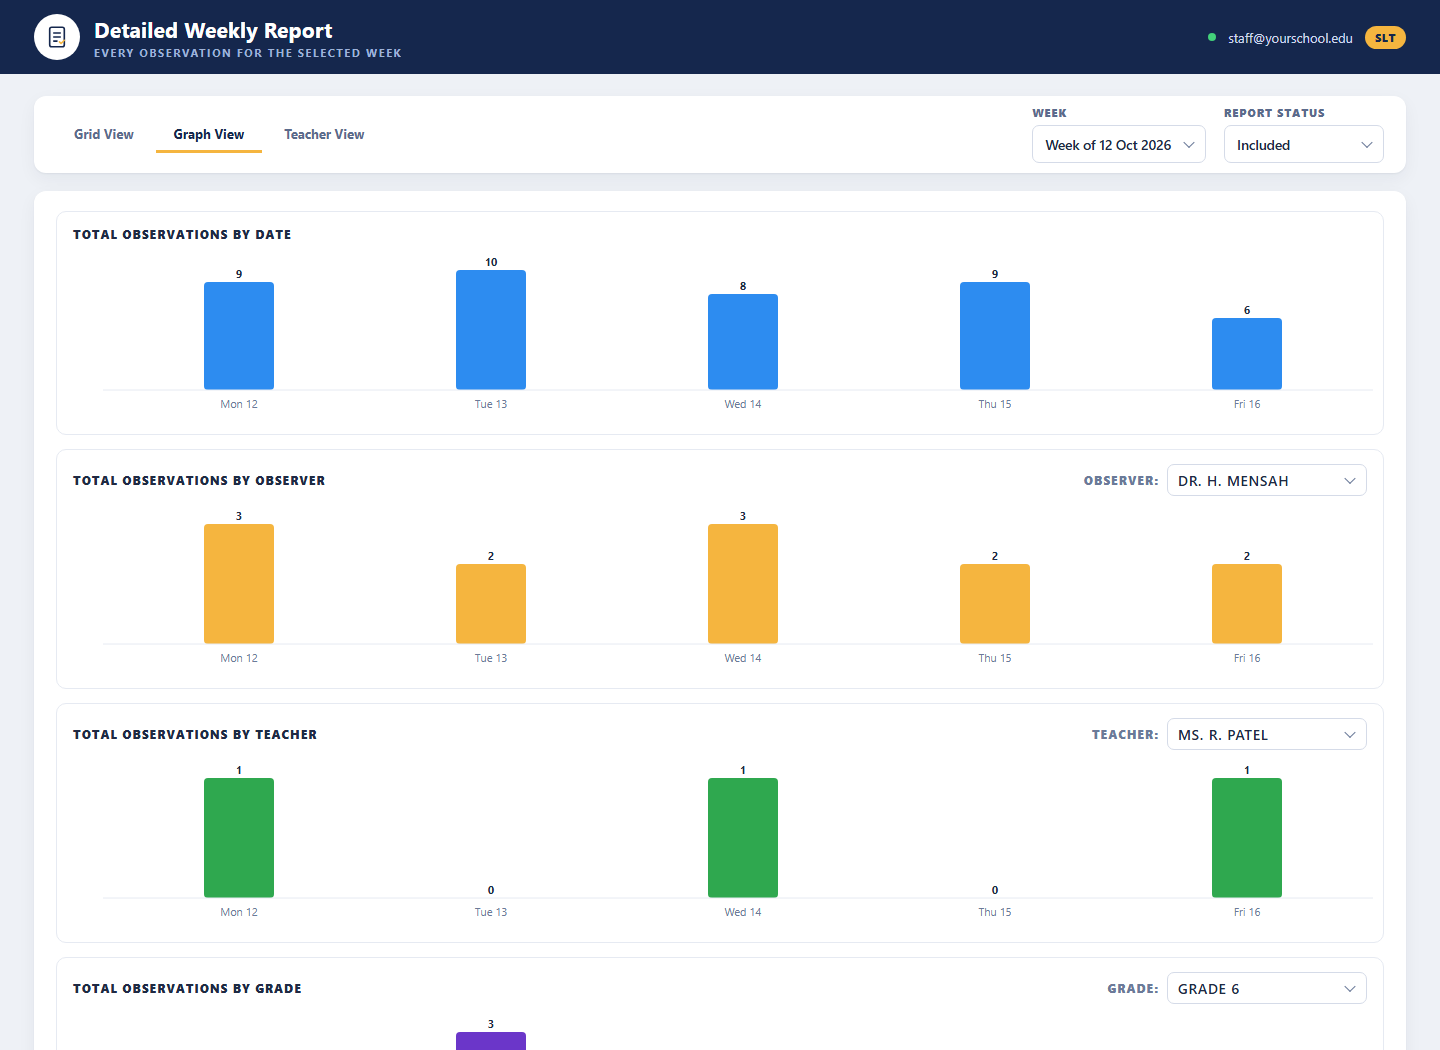
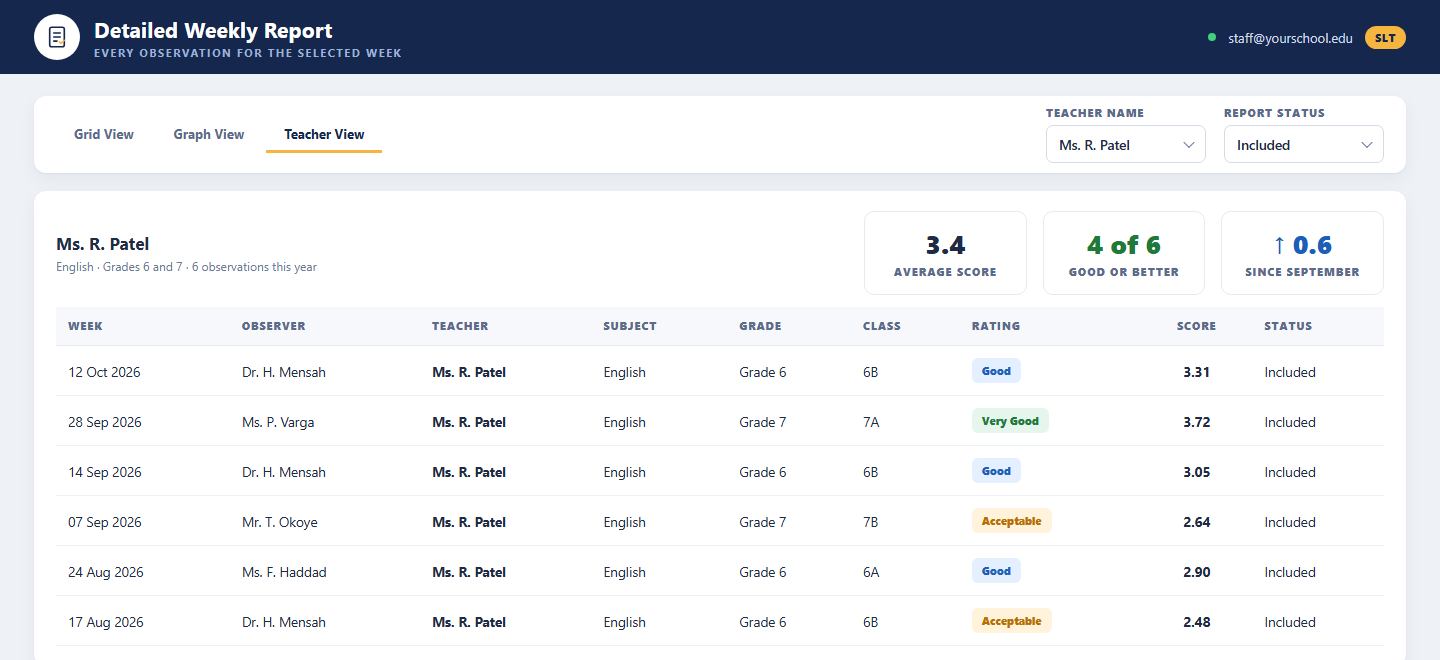
The Weekly KPI Report answers the school’s own question, whether at least 75% of lessons were judged Good or better, with the shortfall or surplus, the previous week and the week-on-week change. It compares judgements with the previous week, counts observations by subject and by observer, lists the classes each senior leader has targeted for improvement, flags teachers with consecutive weak teaching alongside the agreed actions, and summarises checked notebooks by observer. The Detailed Weekly Report offers a grid view of every observation with edit and delete, a graph view of observations and scores over the week by observer, teacher, grade and subject, and a teacher view of one teacher’s observation history. Everything runs on the BDB Platform.
- Three weighted domains rated Weak to Outstanding with an automatic overall score
- Work scrutiny of notebooks with four judgement areas and an agreed area of improvement
- Weekly KPI report on the share of lessons judged Good or better against the 75% target
- Detailed report with grid, graph and teacher views and lists of classes and teachers to support

What It Does
Observation Form
Rate items in three weighted domains on the five-level scale, record work scrutiny and an area of improvement, and save and submit, with any existing observation for the week reopened for editing.
Weekly KPI Report
The share of lessons judged Good or better against the 75% target, week-on-week comparison, observations by subject and observer, targeted classes, teachers needing support and notebook checks.
Detailed Weekly Report
Grid, graph and teacher views of every observation in the week, filtered by report status, with edit and delete and charts by observer, teacher, grade and subject.
Who It Serves
Record what they see and target support
- Select observer, teacher, subject, grade and class for the week
- Rate every item in the three domains from Weak to Outstanding
- Record notebook checks and four work scrutiny judgements
- Agree an area of improvement and save and submit
- Reopen an existing observation for the week to edit it
- See the classes they have targeted for improvement
Track the quality of teaching every week
- Check whether 75% of lessons were judged Good or better
- Compare judgements with the previous week
- See observations by subject and by observer
- Review teachers with consecutive weak teaching and the agreed actions
- Follow checked notebooks and good-or-better work by observer
- Export the KPI and detailed reports
See their own observation history
- View each observation with observer, subject, grade and class
- See the rating and overall score for every lesson
- Follow their average score and progress over the year
- Read the agreed area of improvement after each observation
- Know which observations are included in the weekly report
- Prepare for follow-up observations with a clear record
How It Works
From the classroom to the weekly KPI in four steps
An observer records the lesson against the three weighted domains and completes the work scrutiny, and the tracker calculates the overall score. Observations are marked as included in the weekly report. At the end of the week the KPI report is produced automatically, leaders review the detailed grid, graph and teacher views, and the classes targeted for improvement and the teachers needing support are followed up the next week.
Observe
Select the teacher, subject, grade and class, rate each domain item from Weak to Outstanding and complete the work scrutiny.
Score
The tracker averages each domain and applies the 25%, 70% and 5% weights to produce the overall score and judgement.
Report
The weekly KPI report shows the share of Good-or-better lessons against the 75% target, with comparisons and breakdowns.
Follow up
Leaders target classes for improvement, support teachers with consecutive weak teaching and track progress next week.
Benefits and Features
Three Weighted Domains
Classroom Environment and Management at 25%, Academic Performance at 70% and Professional Development Targets at 5%, each with its own rated items.
Five-Level Rating Scale
Weak, Acceptable, Good, Very Good and Outstanding scored 1 to 5, with N/A excluded from averages, and an automatic domain and overall score.
Work Scrutiny
Notebooks checked and those with good or better work, plus judgements on alignment to objectives, teacher feedback, strengths and improvements, and rigour and presentation.
Area of Improvement
An agreed improvement note on every observation, saved with the ratings and visible in the teacher’s history.
Duplicate Protection
If an observation already exists for the same observer, teacher, subject, grade and class in the week, it is reopened for editing instead of duplicated.
Weekly KPI-P4.1 Report
The share of lessons judged Good or better against the 75% target, with shortfall, previous week and week-on-week improvement.
Comparisons & Breakdowns
Judgements compared with last week, observations by subject and by observer, and checked notebooks by observer.
Targeted Classes & Support
Classes targeted for improvement by each senior leader and teachers with consecutive weak teaching, with the actions agreed.
Grid, Graph & Teacher Views
Every observation in a grid with edit and delete, charts over the week by observer, teacher, grade and subject, and each teacher’s own history.
Platform Screens
Three Roles, One Platform
Observers
Senior leaders sign in with their institution account to record lesson observations, work scrutiny and areas of improvement for the week.
Leadership Team
Review the weekly KPI report and the detailed grid, graph and teacher views, target classes for improvement and agree support for teachers.
Teachers
See their own observation history, ratings, overall scores and the agreed areas of improvement.
Tailored to Your Institution
Flexible by design
The solution provides flexibility to tailor components to the institution’s own identity and requirements. Logo, branding, colour theme, communication style, terminology, workflows and other institution-specific requirements can be customised if required.
Every element seen in the demo is a starting point. Yujaa configures the solution around how your senior leadership team already works, so everyone experiences a platform that feels like their own.
Logo & Branding
Institution logo, name and visual identity across every portal and email.
Colour Theme
Palette and styling aligned to the institution’s brand guidelines.
Communication & Terminology
Email tone, labels and terms matched to how the institution speaks.
Workflows
Approval steps, forms and role permissions set to local requirements.
Ready to See How Teaching Is Going Every Week?
Walk through the observation form, the weekly KPI report and the detailed grid, graph and teacher views with the Yujaa team. Built and hosted on the BDB Platform.